present
注册即可在首次购物时获得 $50 优惠
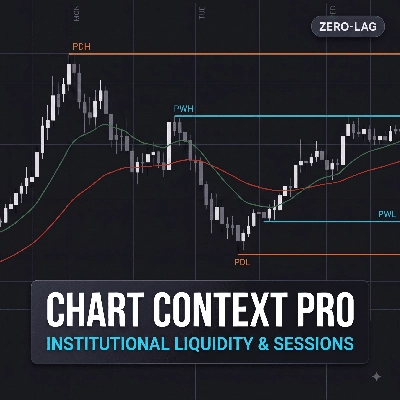
Trading product for DayContextPro 指标 Key Levels Support & Resistance, image 1
DayContextPro
指标
1 下载
版本 1.1, Oct 2026
Windows 版、Mac 版
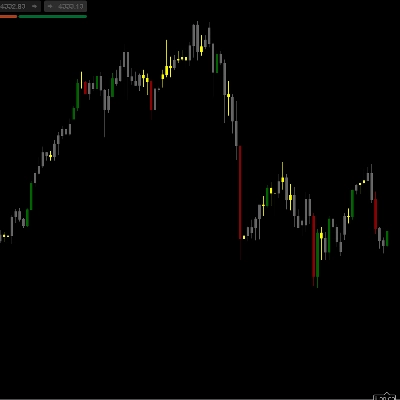
Trading product for DayContextPro 指标 Key Levels Support & Resistance, image 2
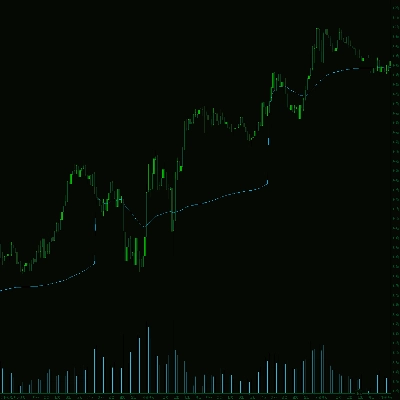
Trading product for DayContextPro 指标 Key Levels Support & Resistance, image 3
注册日期 09/03/2026
48
免费安装

说明

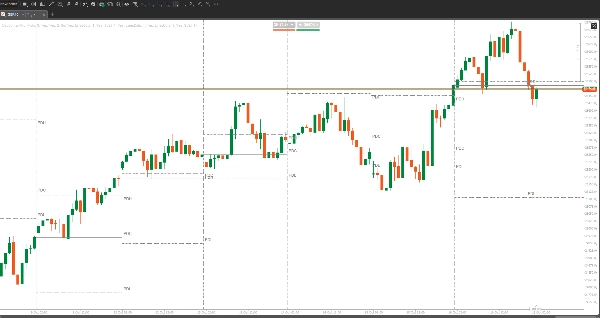
DayContextPro gives intraday charts a clean daily structure. It marks where each trading day and week begins, and carries the previous day’s high, low and close into the next day. These lines are drawn for every day in the chart’s history, not just today, so you can scroll back and see how price reacted to these levels day after day.

Indicator type: Price action and support/resistance (chart overlay)
Preferred instruments: FX pairs, gold, indices and any symbol with a daily session
Preferred periods: M1 to H1. The indicator draws nothing on H2 and above.
Platform: cTrader Windows and Mac (desktop only)

Trading use cases

  • Seeing where each day and week starts at a glance
  • Watching how price reacts at the previous day’s high, low and close
  • Reviewing past days to study breakouts, sweeps and rejections at these levels
  • Planning targets and stops around the previous day’s range

What it draws

  • Day separator: a lines-dots vertical line at the start of each trading day
  • Week separator: a solid vertical line at each week boundary
  • Previous day high and low (PDH/PDL): lines-dots lines across the following day
  • Previous day close (PDC): a solid line across the following day

Each day’s levels span that day only, so past days stay easy to read. Today’s levels run to the right edge of the chart. PDH, PDL and PDC labels show for today, with an option to label past days too.

Accurate trading days
Days follow your broker’s own daily candles, so the lines match its D1 chart. On brokers with a short Sunday candle, that candle counts as part of Monday, so Friday’s levels carry into Monday as they should.

Colors that fit your chart
In Auto mode, lines are grey on a light chart and white on a dark chart. They update straight away if you switch theme. In Custom mode, every line type has its own color.

Settings

  • Show or hide each line type
  • Colour, line style and thickness for each line type
  • Number of past days to draw (all by default)
  • Label options

Notes

  • The indicator does not place trades or predict price.
  • Previous day levels are reference points, not signals. Always use proper risk management.

Trading involves risk. Past performance does not guarantee future results.

摘要

AI summary
DayContextPro is a chart overlay indicator designed for cTrader desktop (Windows and Mac) that enhances intraday price action analysis on M1 to H1 timeframes. It visually structures intraday charts by marking the start of each trading day and week with vertical separator lines. The indicator also plots the previous day’s high, low, and close levels as horizontal lines extending across the following day, allowing traders to observe how price interacts with these key reference points over time.

Key features include:
- Day separators (lines-dots vertical lines) and week separators (solid vertical lines).
- Previous day high and low (PDH/PDL) shown as lines-dots lines.
- Previous day close (PDC) shown as a solid horizontal line.
- Levels are drawn for every day in the chart history, not just the current day.
- Labels for today’s PDH, PDL, and PDC with optional labels for past days.
- Automatic color adaptation to chart theme or customizable colors and line styles.
- Settings to show/hide line types, adjust colors, line thickness, and number of past days displayed.

The indicator uses the broker’s daily candle definitions to ensure accurate daily boundaries. It supports FX pairs, gold, indices, and any symbol with a daily session. DayContextPro does not generate trade signals or place trades; it provides visual reference levels to assist with planning targets, stops, and studying price behavior around previous day ranges.

指标配置

客户评价

0.0
评价:0
客户评价
该产品尚无评价。已经试过了?抢先告诉其他人!

讨论

常见问答

Key Levels
Support & Resistance
cTrader Store 提供的所有产品,包括交易机器人、指标和插件,均由第三方开发者提供,仅供信息参考和技术访问之用。cTrader Store 并非经纪商,不提供投资建议、个人推荐或任何未来业绩保证。

该作者的其他作品

指标
Key Levels
Every major liquidity level drawn for you: PDH/PDL, PWH/PWL, PMH/PML and more. Same price on every timeframe. Free.
桌面插件
Prop Firm Fit
Trade Journal
+1
Paper trade your broker’s live prices in cTrader: demo accounts, prop challenges, a stats dashboard and trading journal
指标
Fair Value Gap
Auto-draws every Fair Value Gap on any timeframe and removes it once filled. Clean, fast, free. Built for cTrader.
桌面插件
Trade Journal
Trade Statistics
Track. Analyze. Improve. A journal and statistics for your real cTrader trades, with a prop challenge guard.
指标
EMA
Outlines the first candle of the real session open for indices, forex & crypto. Auto DST, HTF candle panel & EMA.
指标
EMA
Flag
+2
Liquidity levels, trend lines, filtered chart patterns and a composite bias HUD in one cTrader overlay.
桌面插件
SL Manager
Risk/Reward
+5
Drag SL & TP on the chart, see risk, reward, R:R and lot size live, then place Buy or Sell orders in one click
指标
BOS
CHOCH
+5
SMC structure indicator for cTrader: BOS/CHoCH, order blocks, FVGs, liquidity sweeps, key levels and alerts.
桌面插件
Chart UI Tools
Replay your broker’s charts candle by candle. Rewind any time, switch timeframes and practise trades with full stats.

猜您喜欢

指标
ATR
Wedge
+2
Strong Supertrend Turn Market Movement into a Clear Map Market analysis
指标
Prop
Forex
+2
Market Session Indicator
指标
Forex
BTCUSD
+13
Sniper Zone Pro: High-precision institutional zones and candle strength for identifying key market tests.
指标
ATR
Channel
Reversal Trap Probability Bands plots a dynamic volatility envelope around price & automatically detects "trap" reversal
"VWAP Pro" 标识
评分最高
5.0
(7)
免费
指标
VWAP
Forex
Advanced VWAP with up to 30 anchored levels, multiple timeframes, memory mode, standard deviation bands & simple GUI
指标
VWAP
VWAP Set to London Open
指标
SMC
VWAP
+5
Most advanced Volume Profile Pivot Box indicator — auto pivots, volume zones, smart candle coloring & SMC trading tool.
指标
Fair Value Gap
Liquidity Grab
+2
PRO Liquidity Sweep + FVG Combo detector with custom Gold/Blue signals & alerts
指标
RSI
MACD
+7
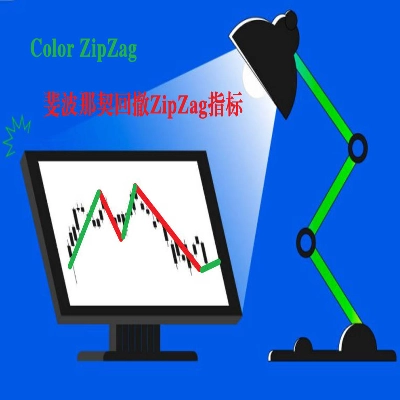
The ZigZag indicator is a technical analysis tool primarily used to identify key price reversal points.
指标
ATR
Prop
+14
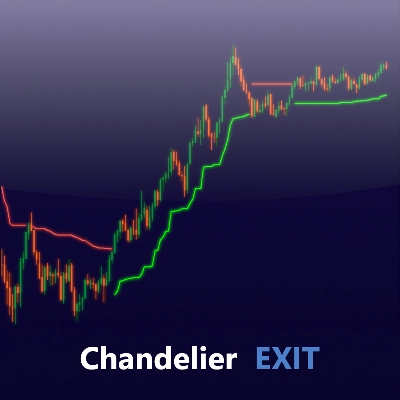
Optimize exits with Chandelier Exit! Visualize stop-loss points dynamically for improved trading precision and safety.
指标
Prop
Forex
+4
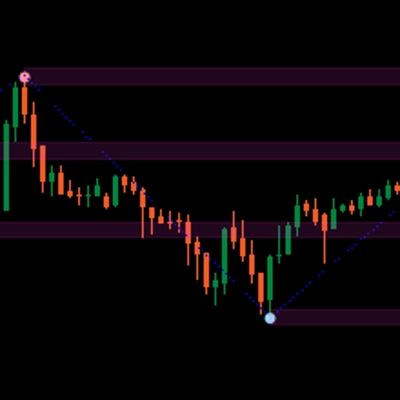
Automatic Support/Resistance zones from swing points.
指标
SMC
Prop
+13
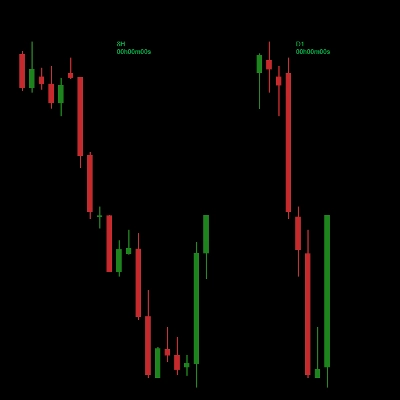
Perfect for traders who demand a clear overview of multiple timeframes at a glance.
指标
AI
ATR
+26
MacD Custom Indicator-Multiple Time Frame
指标
AI
ATR
+27
Supertrend Indicator
指标
MSS
Volume
+3
Rejection-based volume profile with tiered heat zones, POC levels and a fully draggable anchor on cTrader.
指标
Forex
Real-Time Candlestick Pattern Detection with Custom Alerts & Trend Analysis for cTrader
指标
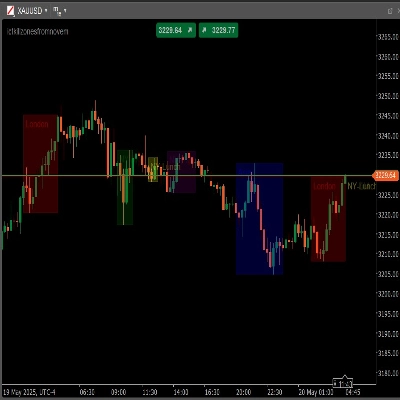
ICT ALL KİLL ZONES, LONDON , ASİA, NY AM, NY LUNCH, NY PM
指标
Doji
Volume
+5
Instantly spot high-liquidity institutional moves with clean, non-obtrusive triangle alerts on cTrader charts.

价格

注册日期 09/03/2026
48
免费安装