
说明
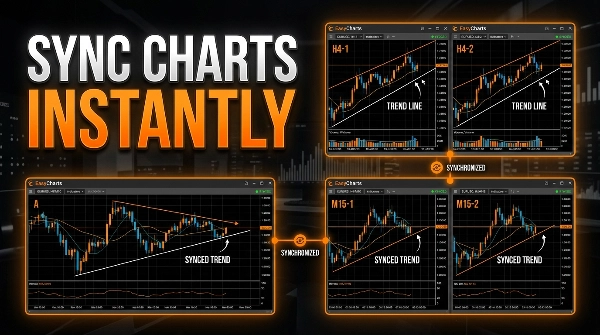
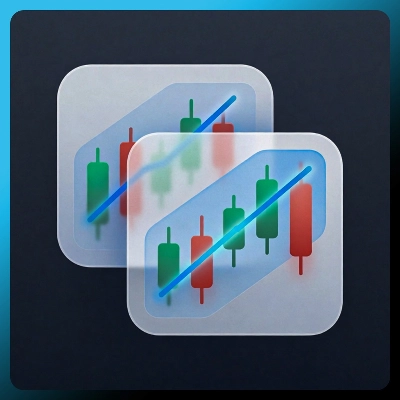
EasyCharts™ 是一个 cTrader 插件,可同步同一交易品种所有打开图表上的技术绘图。
在多个图表中管理和更新您的图表绘图可能变得繁琐。 EasyCharts™ 每个交易品种保持一套一致的绘图,您可以在任何时间框架上工作,而无需单独维护每个图表。
免费 • 轻量 • 易于使用
EasyCharts™ 让图表绘图同步变得简单,无需复杂设置或不必要的功能。花更少时间研究工具,把钱省下来用于更重要的事情。
主要功能
- 双向同步: 绘图可以在任何图表上创建、移动和编辑。
- 准确的时间和价格对齐: 绘图通过其实际的时间和价格坐标同步,而非柱索引。
- 实时拖动: 其他图表可以在您拖动对象时实时跟随更改,或仅在释放鼠标时更新。
- 支持绘图工具:同步 cTrader API 支持的绘图对象,包括:
-
- 水平线、垂直线和趋势线
- 矩形、椭圆、三角形和通道
- 箭头、文本和自定义图标
- 斐波那契、安德鲁叉和艾略特波浪
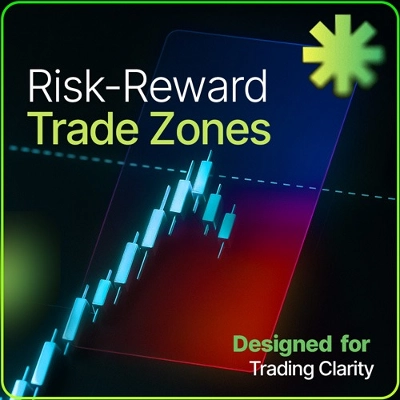
- 风险/回报工具
- 样式同步: 颜色、线条粗细、线条样式、锁定状态、可见性、扩展和文本设置与绘图一起同步。
- 删除处理: 删除绘图会从其他图表中移除。更改交易品种或时间框架,或关闭图表,不会删除您的绘图。
- 自动追赶: 打开同一交易品种的另一个图表,其现有绘图会自动填充,通常在一秒内完成。
- 按品种控制: 通过单个工具栏按钮切换同步。您的偏好会被记住。
- 自定义视觉默认值:
-
- 新矩形默认使用 25% 不透明度。
- 风险/回报工具使用您配置的风险/回报颜色和不透明度。
- 更改对象颜色时保持透明度。
- 选择性同步: 指标、cBots 和其他插件创建的绘图保持不变。您可以通过名称前缀排除绘图;
TradeFlow和HKTP默认被排除。
如何使用 EasyCharts™
- 在所需交易品种上启用插件。
- 在任何图表上绘制或编辑对象。
EasyCharts™ 会自动保持绘图同步。无需额外设置。
限制和注意事项
- 仅同步图表绘图: 直接在图表上绘制的对象会同步。由指标或 cBots 生成的水平线、标记和标签不会在图表间同步。
- 不支持的绘图: 铅笔绘图和甘氏水平线不会被复制。
摘要
AI 摘要
wt.EasyCharts FREE is a cTrader plugin designed to synchronize technical drawings across all open charts of the same trading symbol. It maintains a single consistent set of drawings per symbol, allowing users to work seamlessly across multiple timeframes without manually updating each chart. The plugin supports two-way synchronization, enabling creation, movement, and editing of drawings on any chart with changes reflected instantly or upon mouse release.
Drawings are aligned accurately by their actual time and price coordinates rather than bar indexes. Supported drawing tools include horizontal, vertical, and trend lines; rectangles, ellipses, triangles, and channels; arrows, text, and custom icons; Fibonacci retracements, Andrew’s Pitchfork, Elliott waves; and risk/reward tools. Style attributes such as colors, line thickness, visibility, and text settings are also synchronized.
Additional features include automatic drawing population when opening new charts for the same symbol, deletion propagation across charts, per-symbol sync toggling, and selective synchronization that excludes drawings created by indicators or other plugins. The plugin is lightweight, easy to use, and requires minimal setup: enable it on a symbol and start drawing. It does not sync indicator or cBot-generated levels and does not support pencil drawings or Gann levels.
插件配置
插件类别
实用工具
数据访问
图表
支持的订单类型
限价单
止损限价单
止损单
风险模型
固定手数
固定风险百分比
基于净值
讨论
客户评价
0.0
评价:0
客户评价
该产品尚无评价。已经试过了?抢先告诉其他人!
常见问答
Chart UI Tools
Risk/Reward
cTrader Store 提供的所有产品,包括交易机器人、指标和插件,均由第三方开发者提供,仅供信息参考和技术访问之用。cTrader Store 并非经纪商,不提供投资建议、个人推荐或任何未来业绩保证。









价格
99.81M
交易量
150.07K
盈利点数
100
销售
528
免费安装