
Description
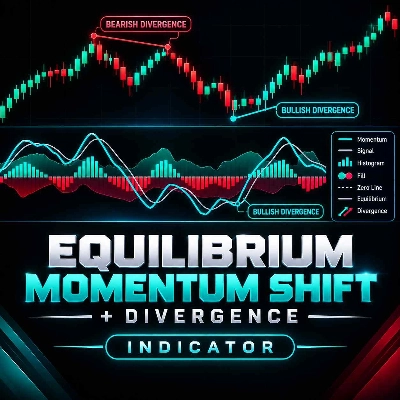
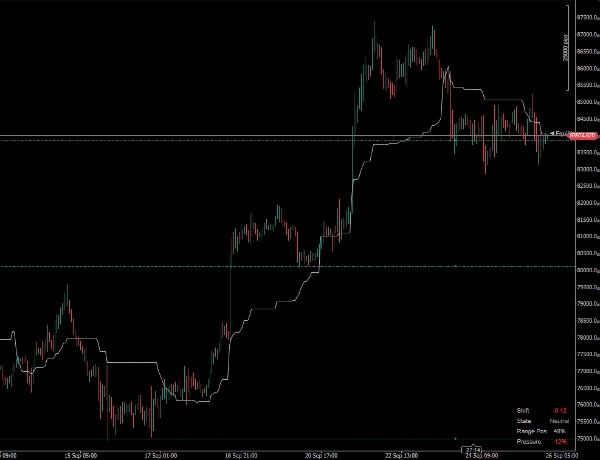
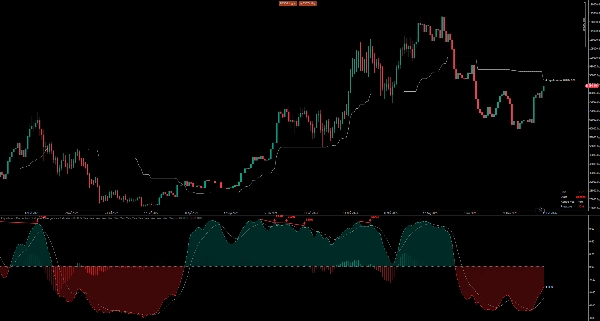
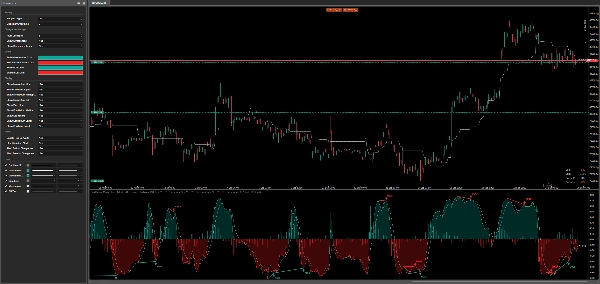
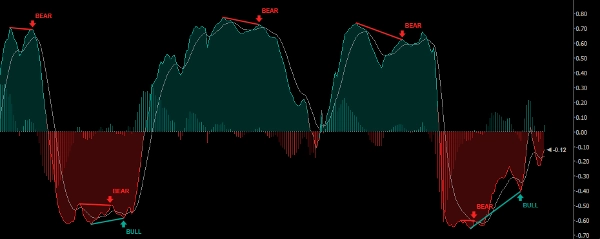
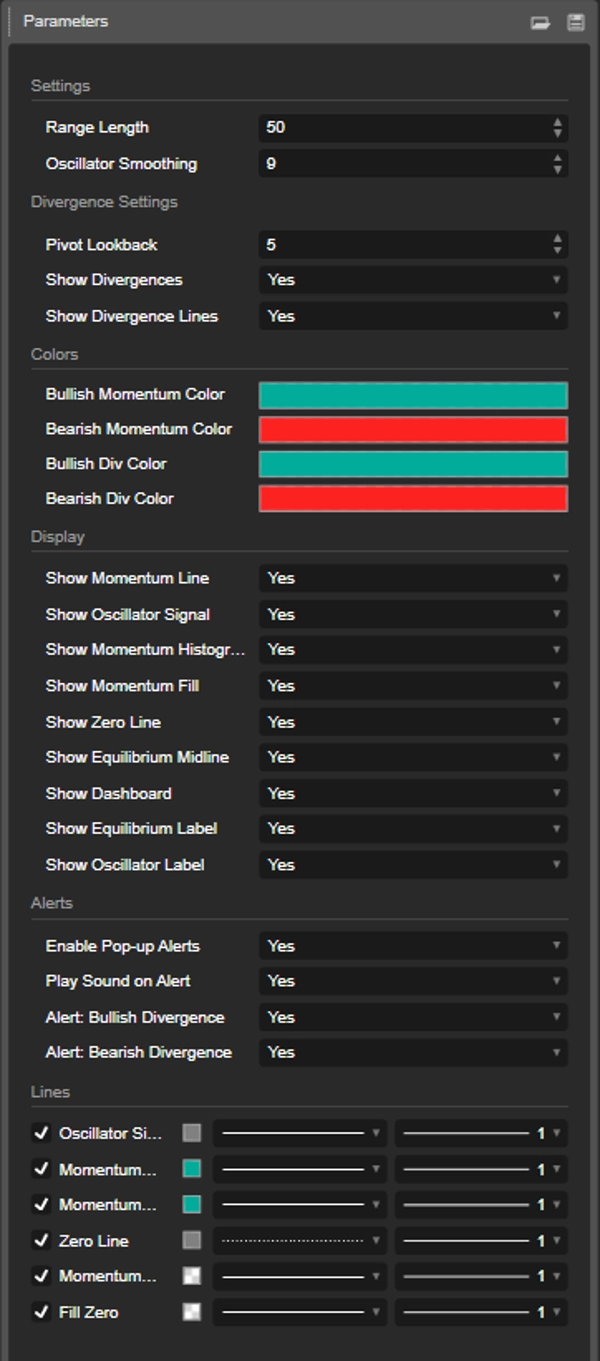
Equilibrium Momentum Shift + Divergence - Indicator A range-normalized momentum oscillator for cTrader. It combines an adaptive equilibrium price, a compressed momentum line, an EMA signal, a momentum histogram and regular bullish and bearish divergence detection in one visual tool. It shows where price sits inside its recent range, how momentum is changing, and where price and momentum disagree. HOW IT WORKS Equilibrium price: the midpoint of the highest high and lowest low over Range Length (default 50 bars), plotted as a line on the price chart. Price deviation: the distance between the current close and the equilibrium price, smoothed twice with fixed EMA(10) stages and converted into a double-EMA momentum value. Normalized momentum: the smoothed deviation divided by half of the current high-low range and compressed with tanh. The oscillator is therefore kept on a stable visual scale and approaches +1 or -1 at extreme readings. A zero range sets the oscillator to 0. Signal line: an EMA of the oscillator using Oscillator Smoothing (default 9). Momentum histogram: oscillator minus signal. Positive values mean the oscillator is above its signal, negative values mean it is below. WHAT YOU SEE ON THE CHART Equilibrium line: a theme-responsive line on the price chart at the midpoint of the configured range, with a right-edge label showing the current equilibrium price at the symbol's precision. Momentum line: the main oscillator line, coloured on a gradient from the bearish to the bullish colour between -0.2 and +0.2; readings outside that interval use the nearest endpoint colour. Oscillator signal: a grey EMA line that helps compare current momentum with its smoothed direction. Momentum histogram: positive bars in the bullish colour, negative bars in the bearish colour, with opacity rising as bars move away from zero, so expanding momentum is easy to tell from contracting momentum. Momentum fill: a native cTrader cloud between the momentum line and zero, in a fixed teal and red palette at uniform 25% opacity. Zero line: a dotted reference at 0.0. Divergence markers: an upward arrow below a bullish oscillator trough, a downward arrow above a bearish oscillator peak, each with bold BULL or BEAR text. Optional lines connect the two oscillator pivots behind each divergence, up to 50 lines kept on the chart. Dashboard: Shift, State, Range Pos and Pressure in the corner of the chart. - Shift: the current oscillator value, with a plus sign when positive. - State: bullish above +0.2, bearish below -0.2, neutral between or exactly at the thresholds. - Range Pos: where the close sits inside the current high-low range - 0% at the range low, 100% at the range high, and an intermediate percentage in between. A zero-width range returns 0%. - Pressure: the absolute oscillator value multiplied by 100, signed with the oscillator direction. It is a normalized momentum reading, not a probability, forecast, expected return or volume measurement. DIVERGENCE DETECTION Regular bullish divergence: the current oscillator trough is higher than the previous trough while the low on the same pivot candle is lower than the low on the previous pivot candle. Regular bearish divergence: the current oscillator peak is lower than the previous peak while the high on the same pivot candle is higher than the high on the previous pivot candle. Pivot Lookback (default 5) sets how many oscillator candles are required on both sides of a pivot. Pivots are detected on the oscillator, not on price, and every confirmed oscillator pivot becomes the next comparison point, including pivots that create no divergence. A divergence is confirmed only after enough candles have closed to the right of the pivot. The arrow, text and line are placed back on the pivot candle, so the marker shows up later than the candle it is drawn on. This is confirmation-delay backpainting, not a signal that was available at the pivot itself. SETTINGS Range Length (default 50, minimum 1): candles used for the highest high and lowest low behind the equilibrium and the normalization range. Oscillator Smoothing (default 9, minimum 1): EMA period for the signal line and the histogram. Pivot Lookback (default 5, minimum 1): oscillator candles required on each side of a pivot. Show Divergences and Show Divergence Lines: the arrows and text independently of the connecting lines. Colours: Bullish Momentum Color and Bearish Momentum Color drive the histogram and the ends of the line gradient; Bullish Div Color and Bearish Div Color drive the divergence arrows, text and lines. Display switches: Show Momentum Line, Show Oscillator Signal, Show Momentum Histogram, Show Momentum Fill, Show Zero Line, Show Equilibrium Midline, Show Dashboard, Show Equilibrium Label, Show Oscillator Label. Hiding an element does not stop its calculation, change the public series or disable divergence alerts. ALERTS Alert: Bullish Divergence and Alert: Bearish Divergence switch each direction separately. Enable Pop-up Alerts and Play Sound on Alert are independent channels, so you can run sound without a pop-up or a pop-up without sound. Alerts are generated after the pivot-confirmation candle has closed and the next candle is processed. They never fire from a provisional divergence on the live candle. Each direction is limited to one alert per confirmation candle, so multiple ticks cannot repeat it. Display switches do not disable alerts, and loading or reloading history does not replay old divergence alerts. BEST ON Intraday, swing and higher-timeframe analysis on Forex, indices, crypto and commodities. Shorter Range Length and Smoothing values react faster; longer ones read smoother. The indicator suits beginner through advanced traders who already understand momentum oscillators and divergence, and it works as a standalone dashboard or next to price action and trend tools. Suggested workflow: 1. Pick a Range Length and Oscillator Smoothing for your timeframe. 2. Use the equilibrium line as a broad range-position reference, not as an automatic entry or exit level. 3. Compare State and the histogram to see whether momentum agrees with the oscillator direction. 4. Treat confirmed BULL and BEAR arrows as momentum warnings and confirm them with price action, trend structure, support and resistance, or a higher timeframe. AUTOMATION AND DATA SERIES Oscillator, Equilibrium, BullishDivergence and BearishDivergence are public series and stay available even when their visuals are hidden. BullishDivergence and BearishDivergence hold the oscillator value of the pivot on the confirmation bar, and NaN when no signal exists. The series are recorded on the confirmation index while the chart marker is drawn back on the pivot index, so automated strategies should use closed bars and handle NaN values. NOTES Warm-up: the indicator does not wait for the full Range Length. Early calculations use the available history and the moving range expands as candles load, so early EMA and oscillator values can depend on the start of the loaded history. Live bar: the oscillator, histogram, dashboard and provisional divergence objects recalculate while the candle is open, so a live divergence can appear, change or disappear before confirmation. Fill: the native cloud uses uniform 25% opacity and fixed colours. The momentum colours change the line and histogram, not the cloud. The indicator does not place, modify or close orders. Divergence alerts are notifications, not buy/sell recommendations or guaranteed signals. A visual tool for analysis only. It doesn't place trades and isn't investment advice.
Summary
Key components include:
- Equilibrium price: midpoint of the highest high and lowest low over a configurable range.
- Normalized momentum: smoothed price deviation scaled to a stable range between -1 and +1.
- Signal line: EMA smoothing of the oscillator.
- Momentum histogram: difference between oscillator and signal line, indicating momentum expansion or contraction.
- Divergence detection: identifies regular bullish and bearish divergences based on oscillator pivots, with visual markers and optional connecting lines.
- Dashboard metrics: current oscillator value, state (bullish, bearish, neutral), range position, and normalized momentum pressure.
Alerts notify users of confirmed bullish or bearish divergences after pivot confirmation. The indicator includes customizable settings for range length, smoothing, pivot lookback, colors, and display elements. It provides public data series for automation but does not execute trades or provide investment advice.