present
가입하고 첫 구매 시 $50 할인을 받으세요
Trading product for RSI Overlay 지표 RSI, image 1
RSI Overlay
지표
버전 1.1, Oct 2026
Windows, Mac
5.0
리뷰: 1
Trading product for RSI Overlay 지표 RSI, image 2
Trading product for RSI Overlay 지표 RSI, image 3
Trading product for RSI Overlay 지표 RSI, image 4
Trading product for RSI Overlay 지표 RSI, image 5
Trading product for RSI Overlay 지표 RSI, image 6
Trading product for RSI Overlay 지표 RSI, image 7
가입일 28/01/2026
4
판매

설명

아이디어

레벨을 가격으로 변환하여 차트에 직접 표시하는 RSI로, 모멘텀과 가격을 별도의 창이 아닌 같은 공간에 유지합니다.


문제점

RSI는 보통 별도의 창에서 읽습니다.

사용하려면 오실레이터 값과 메인 차트의 가격 움직임을 계속 비교해야 합니다.

70, 30, 50과 같은 레벨은 오실레이터 상의 숫자일 뿐입니다. RSI가 해당 레벨에 도달하려면 가격이 어디에 있어야 하는지 알려주지 않습니다.

그래서 눈으로 계속 변환해야 합니다: "RSI가 62인데 차트에서 어디지?"

문제는 RSI 자체가 아닙니다.

문제는 모멘텀과 가격이 서로 다른 두 곳, 서로 다른 단위로 표시된다는 점입니다.


핵심 개념: RSI 레벨이 가격 레벨이 됩니다.

전통적인 RSI는 묻습니다:

"현재 RSI 값은 얼마인가?"

RSI 오버레이는 묻습니다:

"어떤 가격에서 RSI가 이 레벨에 도달할까?"

각 RSI 레벨은 해당 가격 레벨로 변환되어 차트에 직접 표시됩니다.

오실레이터를 한 창에서 읽고 다른 창으로 변환하는 것이 더 이상 필요하지 않습니다.

그 정보는 이미 분석 중인 가격 움직임과 같은 가격 척도로 표현됩니다.

RSI가 레벨을 설정하고 차트가 가격으로 보여줍니다.


기능

RSI 오버레이는 선택된 RSI 참조값을 동적 가격 레벨로 변환하여 메인 차트에 직접 표시합니다.

강세 및 약세 기준선, 과매수 및 과매도 레벨, 그리고 스무딩된 RSI와 평균 RSI 두 가지 RSI 기반 참조값이 모두 가격선으로 표시됩니다.

선들은 각 새 바마다 업데이트되어 과거 가격에 고정되지 않고 최신 RSI 상태를 반영합니다.

이들은 전통적인 지지 또는 저항 레벨이 아닙니다.

현재 RSI 계산에 따라 해당 RSI 값이 도달할 가격을 나타냅니다.

이 지표는 가격이 어디로 갈지 예측하지 않습니다.

관찰 중인 RSI 레벨에 대해 가격이 어디에 위치하는지 보여줍니다.


작동 원리

  1. RSI는 Wilder의 스무딩을 사용하여 계산됩니다.
  2. 각 RSI 레벨은 해당 값을 생성하는 가격으로 변환됩니다.
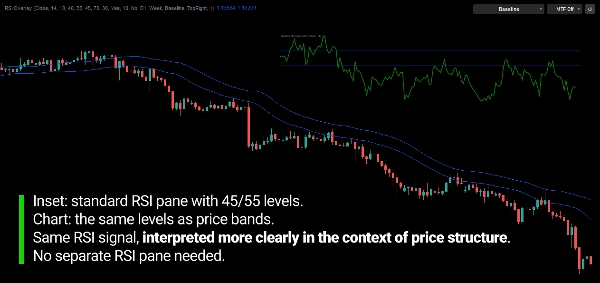
  3. 강세 및 약세 기준선은 중심선 주변의 모멘텀 영역을 표시합니다 (기본값 55 / 45).
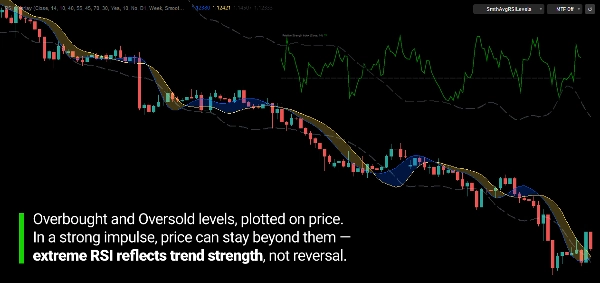
  4. 과매수 및 과매도 레벨도 같은 방식으로 변환됩니다 (기본값 70 / 30).
  5. 스무딩된 RSI와 평균 RSI도 가격선으로 변환됩니다.


RSI 참조값

강세 / 약세 기준선
RSI가 강세 또는 약세 모멘텀 영역에 진입하는 가격 레벨입니다. 이들 사이 공간은 모멘텀이 중립인 영역을 나타냅니다.

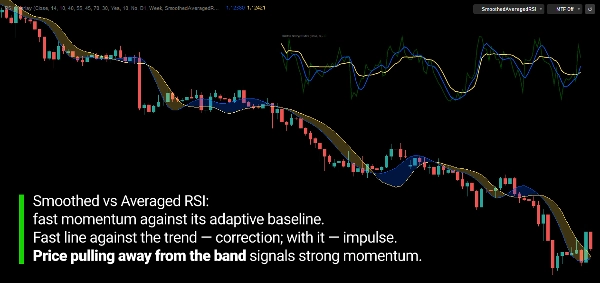
스무딩된 RSI
노이즈가 줄어든 RSI 버전으로, 더 부드럽게 반응하는 가격선으로 표시됩니다.

평균 RSI
더 느리고 적응적인 RSI 평균으로, 가격선으로 표시됩니다. 보다 안정적인 모멘텀 참조를 제공합니다.

과매수 / 과매도
RSI가 과매수 및 과매도 임계값에 도달하는 가격 레벨입니다.

이 참조값들은 자동 신호가 아닙니다.

가격과 서로의 위치는 모멘텀이 어떻게 전개되고 있는지에 대한 맥락을 제공합니다.


다중 타임프레임 컨텍스트

RSI는 보고 있는 차트 타임프레임에서 나올 필요가 없습니다.

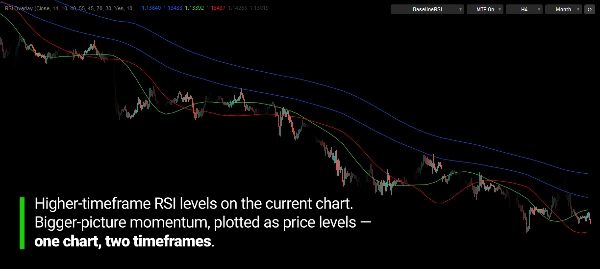
예를 들어, 주간 또는 월간 RSI를 H1 차트에 투영할 수 있습니다.

이렇게 하면 상위 타임프레임 모멘텀 프레임워크가 보고 있는 가격 움직임 위에 직접 표시됩니다.

과거 데이터는 마지막 1시간부터 수년까지 선택할 수 있습니다.

선택한 타임프레임은 차트 타임프레임보다 높아야 합니다.


차트에서 제어하기

11가지 표시 모드로 필요한 것만 표시할 수 있으며, 깔끔한 기준선 쌍부터 전체 RSI 참조 세트까지 선택할 수 있습니다.

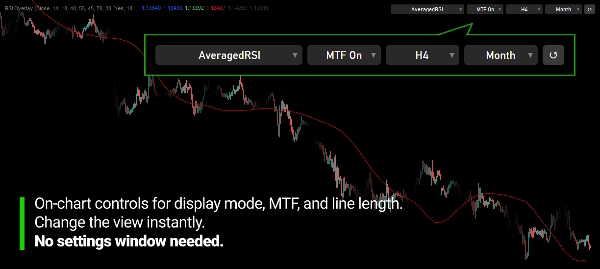
차트의 컴팩트한 제어 바를 통해 표시 모드 전환, 다중 타임프레임 켜기/끄기, 타임프레임 및 길이 변경을 설정 창을 다시 열지 않고 할 수 있습니다.

리셋 버튼으로 모든 설정을 초기 상태로 되돌릴 수 있습니다.

제어 바는 차트의 어느 모서리에도 배치하거나 숨길 수 있습니다.


관찰할 수 있는 것

이 지표는 여러 가지를 시각화하도록 설계되었습니다:

  • 가격이 강세 및 약세 모멘텀 영역에 대해 어디에 위치하는지
  • 가격 측면에서 과매수 및 과매도 레벨과 얼마나 떨어져 있는지
  • 기준선 주변의 모멘텀 변화
  • 스무딩된 RSI와 평균 RSI에 대한 되돌림 및 지속
  • 하위 타임프레임 차트에서 상위 타임프레임 모멘텀 컨텍스트

RSI 오버레이는 독립적인 매수/매도 시스템이 아닌 측정 도구입니다.


가격 측면에서 모멘텀을 위해 제작됨

목적은 RSI를 대체하는 것이 아닙니다.

오실레이터를 눈으로 가격으로 다시 변환할 필요를 없애는 것입니다.

RSI에 대해 알고 있는 모든 것은 여전히 적용됩니다. 단지 실제 결정이 이루어지는 곳인 가격 차트에 표시될 뿐입니다.


주요 특징

  • 메인 차트에서 가격 레벨로 변환된 RSI 레벨
  • 강세 및 약세 기준선 (기본값 55 / 45)
  • 과매수 및 과매도 가격 레벨 (기본값 70 / 30)
  • 스무딩된 RSI 선
  • 평균 RSI 선
  • 하위 타임프레임 차트에서 다중 타임프레임 RSI
  • 다중 타임프레임 선의 표시 길이 선택 가능
  • 11가지 표시 모드
  • 리셋 기능이 있는 차트 내 제어 바
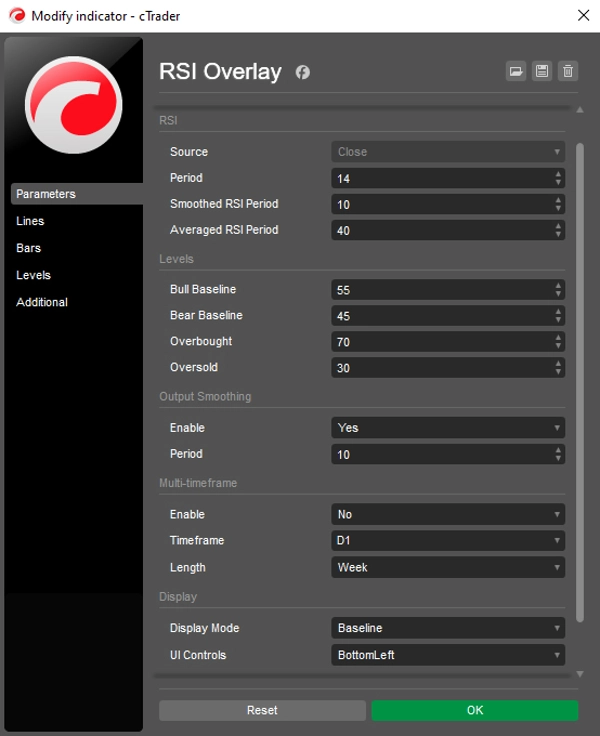
  • 구성 가능한 소스, RSI 기간, 스무딩 및 평균화
  • 사용자 정의 가능한 색상, 선 스타일 및 두께


---


트레이딩은 위험을 수반합니다. 이 지표는 기술적 분석 도구이며 적절한 위험 관리와 함께 사용해야 합니다.

요약

AI summary
RSI Overlay is a technical indicator that projects Relative Strength Index (RSI) levels directly onto the main price chart by converting oscillator values into corresponding price levels. This approach integrates momentum and price analysis within a single chart space, eliminating the need to interpret RSI in a separate pane. The indicator calculates RSI using Wilder's smoothing method and translates key RSI references—such as bullish and bearish momentum baselines (default 55/45), overbought/oversold thresholds (default 70/30), smoothed RSI, and averaged RSI—into dynamic price lines that update with each new bar.

It supports multi-timeframe analysis by allowing RSI data from higher timeframes (e.g., weekly or monthly) to be displayed on lower timeframe charts, providing broader momentum context. Users can customize display modes, line styles, colors, and control parameters directly from an on-chart control bar, which includes options to reset settings and adjust timeframe and length without reopening menus.

RSI Overlay serves as a measurement tool to visualize where price stands relative to momentum zones and RSI thresholds in price terms. It does not generate automatic trading signals but aids in observing momentum shifts, pullbacks, and continuations aligned with RSI levels on the price chart.
지표 프로필

고객 리뷰

5.0
리뷰: 1
5
100 %
4
0 %
3
0 %
2
0 %
1
0 %
고객 리뷰
October 4, 2026
Tested on EURUSD H1 and XAUUSD H1/M1. RSI Overlay displayed its price-based Baseline levels clearly and consistently across different instruments and chart scales. The indicator has a clean layout, configurable parameters and an on-chart menu with eleven display modes. A minor improvement to the dropdown text contrast would make the interface easier to use.

상담

자주 묻는 질문(FAQ)

RSI
트레이딩 봇, 지표, 플러그인 등 cTrader Store에서 제공되는 상품은 제3자 개발자에 의해 제공되며, 이는 단순히 정보 및 기술적 접근을 목적으로 제공된 것입니다. cTrader Store는 중개인이 아니며, 투자 조언, 개인별 추천 또는 향후 성과에 대한 어떠한 보장도 제공하지 않습니다.

이 작성자의 상품 더 보기

지표
Supertrend
Moving Average
Adaptive MA anchored to structural trend changes — no fixed period. Dual Supertrend + swing detection.
지표
Fibonacci
Auto-swing detection driving 7 Fibonacci projections: retracement, expansion, fan, time, pitchfork, channel, Gann.
지표
EMA
SMA
+2
Drag MA to any swing point — MA anchors and recalculates instantly. Not period-based. Structural.
지표
Channel
Fibonacci
Anchor-based Fibonacci channel that grows with the market. Seven display modes, auto-direction, fully draggable.
지표
Volume
Custom range volume profile between two draggable anchors. Auto source timeframe, Total/Up-Down/Delta, POC, Value Area.

좋아하실 만한 다른 항목

지표
AI
Grid
+9
Pivot Point MultiTimeFrame with Order Block
지표
Signal
Scalping
Average accuracy of around 60% to 70% on 45min timeframes it is highly recommended to use stop losses
지표
Prop
Forex
+11
⚡Nebula Range Filter is a professional trend filter indicator for cTrader⚡
지표
ATR
BOS
+5
Opening ranges, dynamic trend channels, and multi-scale breakout/retest analysis for clear intraday chart decisions.
지표
Prop
Forex
+10
IBS Indicator – Measures price position within bars for smarter trades. Works on all markets & timeframes.
지표
SMC
Forex
+5
ICT liquidity engine for Gold: maps stop clusters, scores zones & projects the next target. Now with 4 ICT killzones.
지표
EMA
Volume
+4
Advanced volume‑profile tool with delta, HVN/LVN zones, and precise POC‑based trade signals.
지표
Forex
BTCUSD
+10
6-stage IIR filter trend indicator with colored line segments, reversal signals, alerts, and entry arrows.
지표
Allow trader to draw multi trendlines in different timeframes on one chart,Give trader an overview of the current market
지표
Volume
Channel
+2
Identify key support and resistance levels through detailed volume distribution analysis.
지표
Drawdown Monitor
Protect your funded account. Real-time Daily Equity Drawdown monitor with Green / Orange / Red flashing alerts.
지표
ATR
Prop
+13
Enhance trading with ATR Bands! Visualize market volatility using dynamic upper and lower ATR bands for precise decision
지표
ADX
ATR
+5
Configure, simulate, and analyze trading strategies with custom filters, multi-target exits, and detailed performance me
지표
Breakout
FlexSR auto‑detects pivot highs/lows to plot dynamic support & resistance lines Features customizable styling and option
지표
Forex
GBPUSD
+3
Support & resistance zones with measured hold rates and confidence intervals — evidence, not just lines on a chart.
"crossover 1" 로고
최고 평점
4.2
(5)
$19
/
$29
지표
AI
Grid
+10
Crossover Buy and Sell Alerts and signals
지표
Forex
Crypto
+3
Day of Week Indicator for cTrader
지표
AI
ATR
+5
"Advanced VSA & CVD indicator with 'A+ Setup' filtering based on Support & Resistance levels."

가격

가입일 28/01/2026
4
판매