


Beschreibung
Apex Break PRO zeichnet die wichtigen Trendlinien und bewertet jeden Bruch davon.
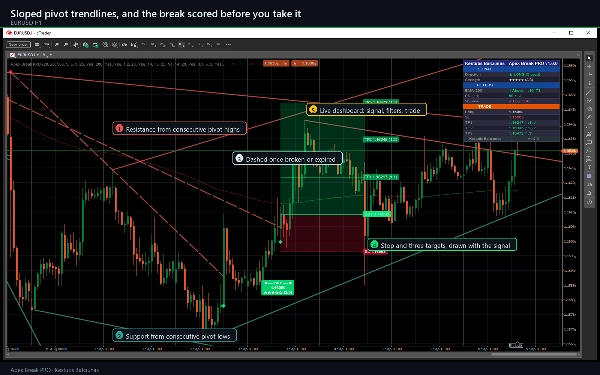
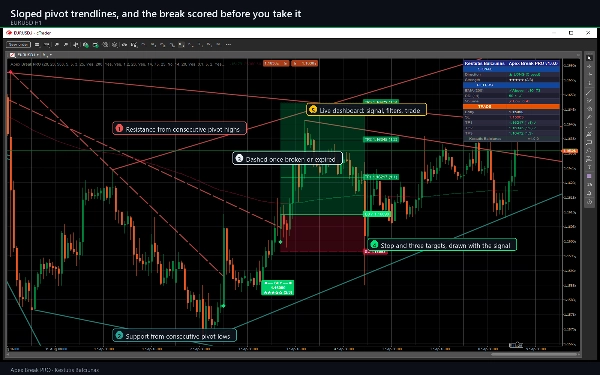
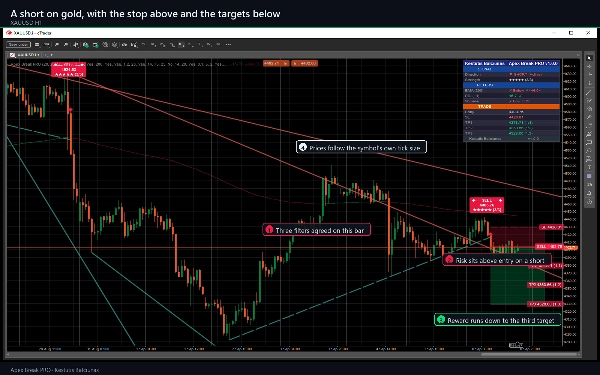
Aufeinanderfolgende Pivot-Hochs bilden eine geneigte Widerstandslinie, aufeinanderfolgende Pivot-Tiefs eine geneigte Unterstützungslinie. Diese sind keine horizontalen Niveaus: Sie folgen der eigenen Richtung des Marktes und laufen ab. Ein Signal erscheint, wenn der Schlusskurs einer BESTÄTIGTEN Kerze eine dieser Linien mit einem in ATR gemessenen Abstand überschreitet, und nur wenn genügend unabhängige Filter zustimmen.
Was es in Ihrem Chart zeichnet
- Geneigte Widerstands- und Unterstützungs-Trendlinien, bis zu fünf von jeder, durchgezogen solange sie aktiv sind und gestrichelt, sobald sie gebrochen sind oder ihre Verlängerung ausgelaufen ist.
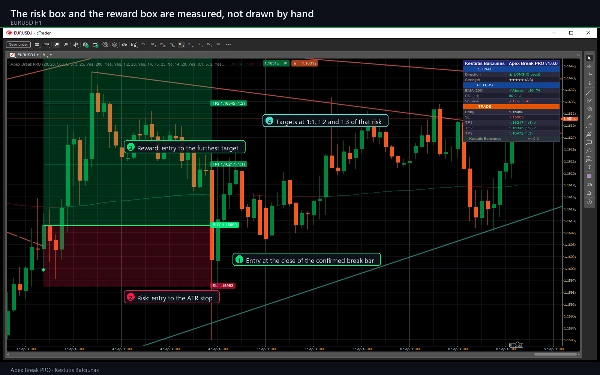
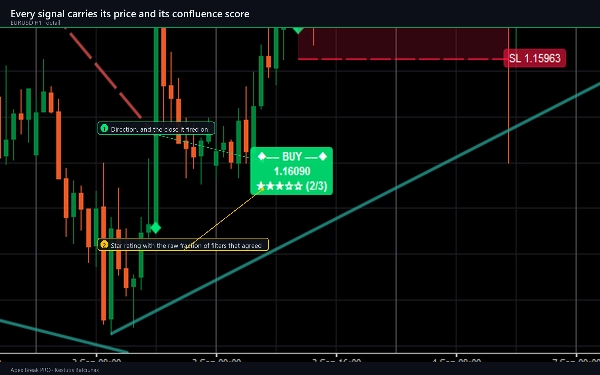
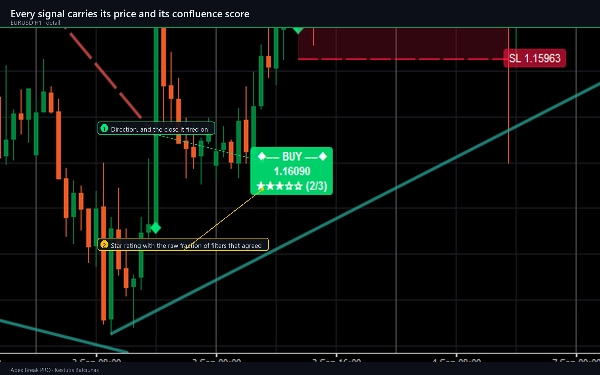
- Ein KAUF- oder VERKAUF-Marker mit einem Label, das den Preis, eine Fünf-Sterne-Bewertung und den Konfluenz-Bruchteil trägt, zum Beispiel 3/4.
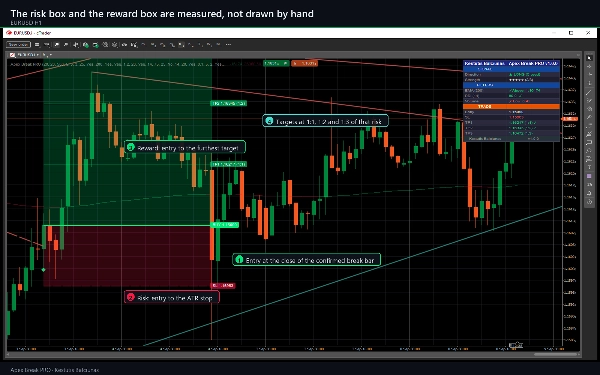
- Der Stop, standardmäßig bei 1,5 x ATR, und drei Ziele bei 1:1, 1:2 und 1:3 dieser Distanz, mit einer schattierten Risikozone und einer schattierten Gewinnzone.
- Der 200 EMA, farblich markiert je nachdem, auf welcher Seite davon der Preis gehandelt wird.
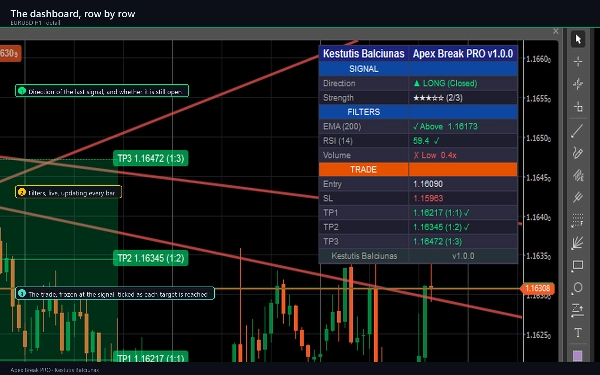
- Ein zweispaltiges Dashboard mit einem SIGNAL-Bereich, einem Live-FILTER-Bereich und einem TRADE-Bereich, der jedes Ziel markiert, sobald es erreicht wird.
Wie man damit handelt
- Geben Sie ihm Historie. Bei den Standardeinstellungen benötigt es etwa 250 Kerzen, bevor die erste Linie erscheint, da der 200 EMA sich erst bilden muss und ein Pivot erst 20 Kerzen nach seiner Entstehung bestätigt wird.
- Warten Sie auf einen Marker. Der Bruch wird an einer geschlossenen Kerze bewertet, daher bewegt sich der Marker nicht, sobald er gedruckt ist.
- Lesen Sie die Sternbewertung und die FILTER-Zeilen, bevor Sie handeln. Die Bewertung gibt an, wie viele der aktivierten Bedingungen bei dieser Kerze übereinstimmten. Es ist eine Beschreibung der Übereinstimmung, keine Wahrscheinlichkeit.
- Verwenden Sie den gezeichneten Stop und die Ziele wie sie sind oder als Vorlage für Ihre eigene Positionsgröße.
- Beobachten Sie die TRADE-Zeilen. Jedes Ziel wird markiert, sobald der Preis es erreicht, und das Tracking endet am Stop oder am dritten Ziel.
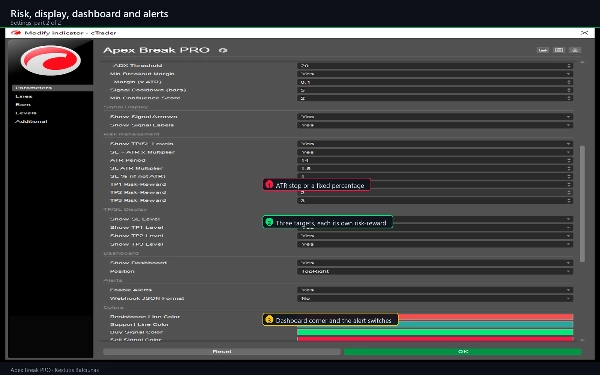
- Schalten Sie die gewünschten Alarme ein. Neun separate Ereignisse sind verfügbar.
Wichtige Einstellungen
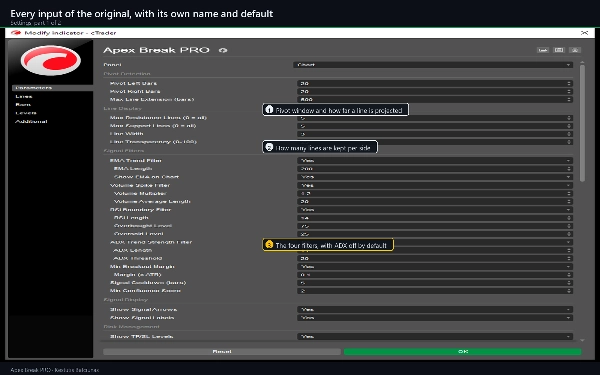
- Pivot-Erkennung: linke und rechte Kerzen, jeweils 20, und eine maximale Linienverlängerung von 500 Kerzen.
- Linienanzeige: bis zu 5 Widerstands- und 5 Unterstützungs-Linien, Breite 3, Transparenz 25.
- Signal-Filter: EMA 200; RSI 14 mit Grenzen bei 75 und 25; Volumen 1.2x seines 20-Kerzen-Durchschnitts; ADX 14 über 20, standardmäßig aus; eine Ausbruchs-Marge von 0,1 x ATR; eine 5-Kerzen-Abkühlzeit; eine Mindestbewertung von 2.
- Risikomanagement: ATR 14, Stop bei 1,5 x ATR oder einem festen Prozentsatz, Ziele bei 1:1, 1:2 und 1:3.
- Dashboard in sechs Positionen, neun Alarm-Schalter und die vier Linien- und Signal-Farben.
Insgesamt 65 Parameter, verteilt auf Pivot-Erkennung, Linienanzeige, Signal-Filter, Risikomanagement, TP/SL-Anzeige, Dashboard, neun Alarm-Schalter mit ihren Übertragungskanälen und die Farben.
Indikatortyp, Perioden, Instrumente, Anwendungsfälle
Ein Unterstützungs- und Widerstands-, Trend- und Volatilitätsindikator, der auf dem Hauptchart zeichnet und Signale ausgibt. Er läuft auf jedem Symbol und jedem Zeitrahmen. M15, H1 und H4 sind die Zeitfenster, für die er entwickelt wurde; niedrigere Perioden liefern mehr Signale mit engeren ATR-Stops, D1 und höher weniger und weitere. Der Volumenfilter wird verwendet, wenn Ihr Broker Volumen liefert, und kann ausgeschaltet werden, wenn nicht. Typische Anwendungen: Trendlinienbruch-Einstiege mit angegebener Konfluenz, ATR-basierte Stop-Setzung, gestaffelte Ausstiege bei 1:1, 1:2 und 1:3, Bestätigung durch höheren Zeitrahmen und Versorgung eines cBots über den versteckten Signalausgang.
Für wen es gedacht ist
Trader, die bereits Trendlinien von Hand zeichnen und möchten, dass diese auf jedem Chart, jedes Mal, auf die gleiche Weise gezeichnet werden, mit Bewertung des Bruchs bevor sie darauf reagieren. Es ist ein Analysetool: Es platziert, ändert oder schließt niemals eine Order und hat keinen Zugriff auf Ihr Konto.
Testversion: was die Vollversion hinzufügt
Die Testversion ist dieselbe Version, beschränkt auf EURUSD, ohne Zeitlimit und mit allen Parametern verfügbar. Bei jedem anderen Symbol zeigt sie eine Meldung anstatt zu zeichnen. Die Vollversion entfernt die Symbol-Sperre: jedes Forex-Paar, Index, Metall, Energie- und Krypto-Symbol, das Ihr Broker anbietet.
Technische Hinweise und Einschränkungen
- Signale werden an geschlossenen Kerzen bewertet und nicht neu gezeichnet. Ein Pivot wird erst bestätigt, nachdem die Pivot-Rechts-Kerzen gebildet wurden, und diese Bestätigungsverzögerung ist der Preis für das Nicht-Neuzeichnen. Die Trendlinien selbst sind vorläufig auf der noch entstehenden Kerze.
- Alarme werden nur für Kerzen ausgelöst, die nach dem Anfügen des Indikators schließen, niemals für die Historie.
- Die Markierungen in den Zielzeilen zeichnen auf, dass der Preis später ein gezeichnetes Niveau in der Historie Ihres Charts berührt hat. Sie sind keine Handelsergebnisse: Kein Spread, Kommission, Swap, Slippage oder Ausführung ist beteiligt, und keine Statistik wird daraus abgeleitet.
- Das Chart behält die neuesten Signal-Labels und Trendlinien und entfernt die ältesten.
- Zwei Broker haben nicht identische Kerzen, daher unterscheiden sich Signale auf einem Live-Chart von demselben Indikator auf einem anderen Feed. Das ist ein Datenunterschied, kein Unterschied in der Berechnung.
- Anforderungen: cTrader 5.0 oder neuer, getestet auf 5.9. Zugriffsrechte: Keine - kein Datei-, Netzwerk- oder Handelszugriff.
Support
Fragen über den Diskussions-Tab dieser Seite oder "Ask seller". Updates sind kostenlos und im Versionsverlauf aufgeführt. Der Store bietet eine 14-tägige Geld-zurück-Garantie. Wenn der Indikator für Sie funktioniert, hilft eine Bewertung anderen Tradern, ihn zu finden.
Trading beinhaltet Risiken. Vergangene Ergebnisse garantieren keine zukünftigen Resultate.
Zusammenfassung
Key features include visual BUY/SELL markers with price labels, star ratings indicating filter confluence, ATR-based stops (default 1.5x ATR), and three profit targets at 1:1, 1:2, and 1:3 risk-reward ratios. It also displays a 200 EMA colored by price position, shaded risk and reward zones, and a two-column dashboard showing live signals, filters, and trade progress.
Signals are generated on confirmed closed bars without repainting, and alerts can be configured for nine different events. The indicator supports volume filtering where available and includes 65 customizable parameters covering pivot detection, line display, filters, risk management, and alerts. Apex Break PRO is intended for traders who manually draw trendlines and seek consistent, scored breakout signals for analysis and trade planning. It does not execute trades or access accounts.





























