Trading Fusion Bars 2
.jpeg)
03/09/2025
1
Desktop

A. Technical Indicators Used
- EMA Fast (50-period) & EMA Slow (200-period)
- Identifies the trend direction (bullish/bearish)
- ATR (14-period)
- Measures market volatility to filter meaningful signals
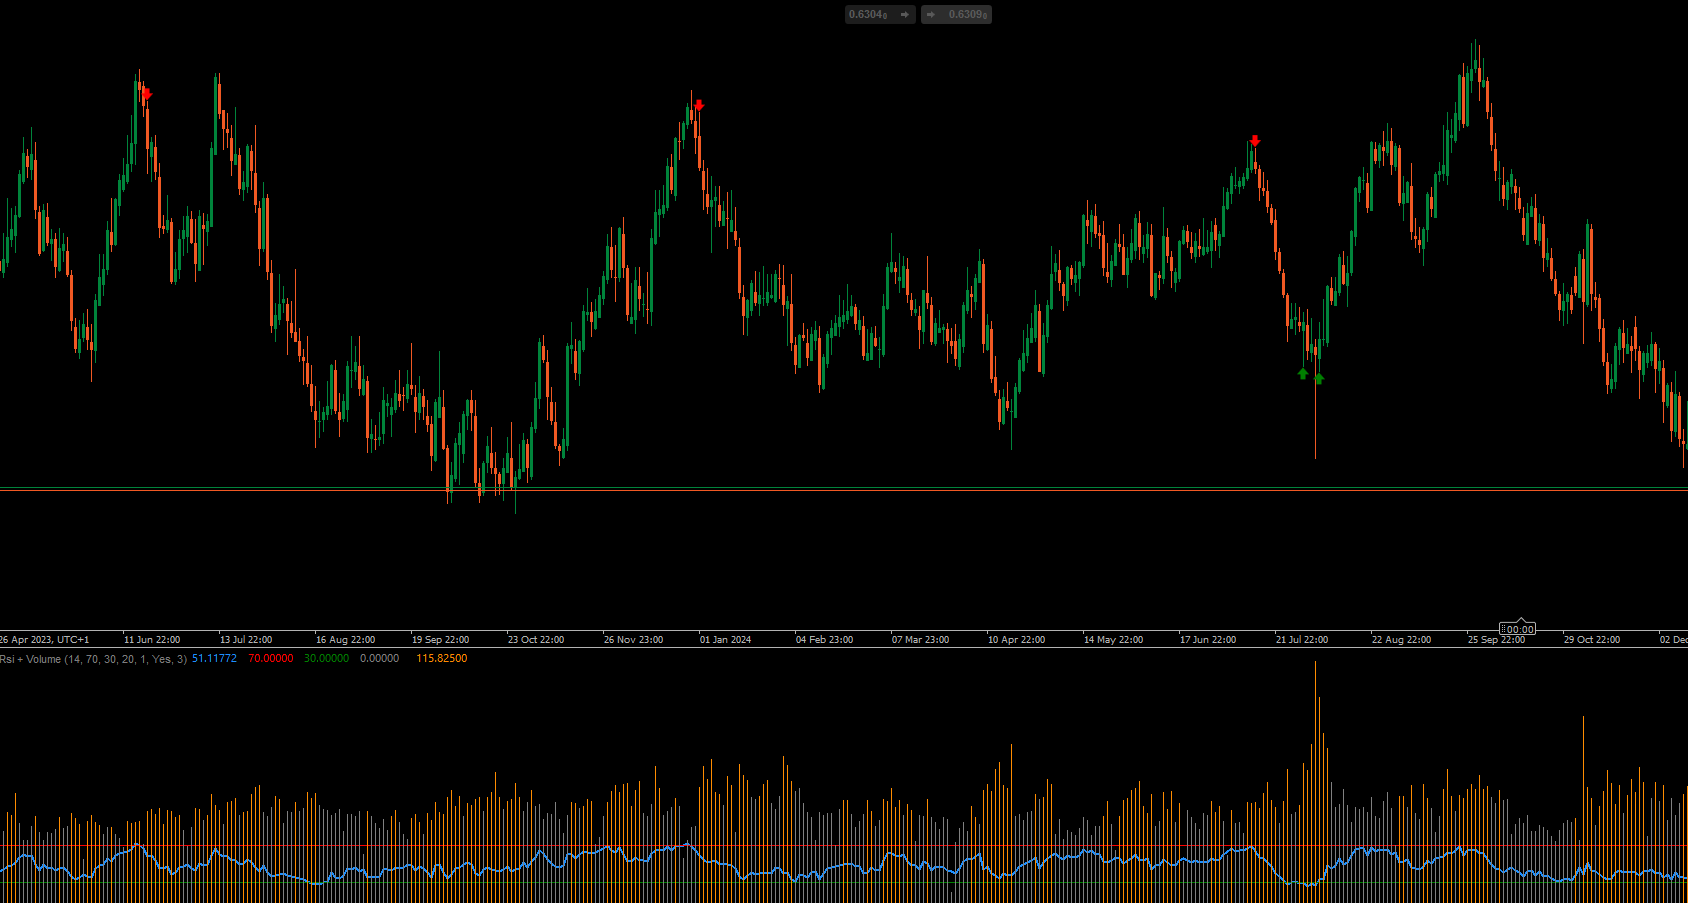
- RSI (14-period)
- Checks if the market is overbought/oversold
- MACD (26,12,9)
- Confirms momentum strength
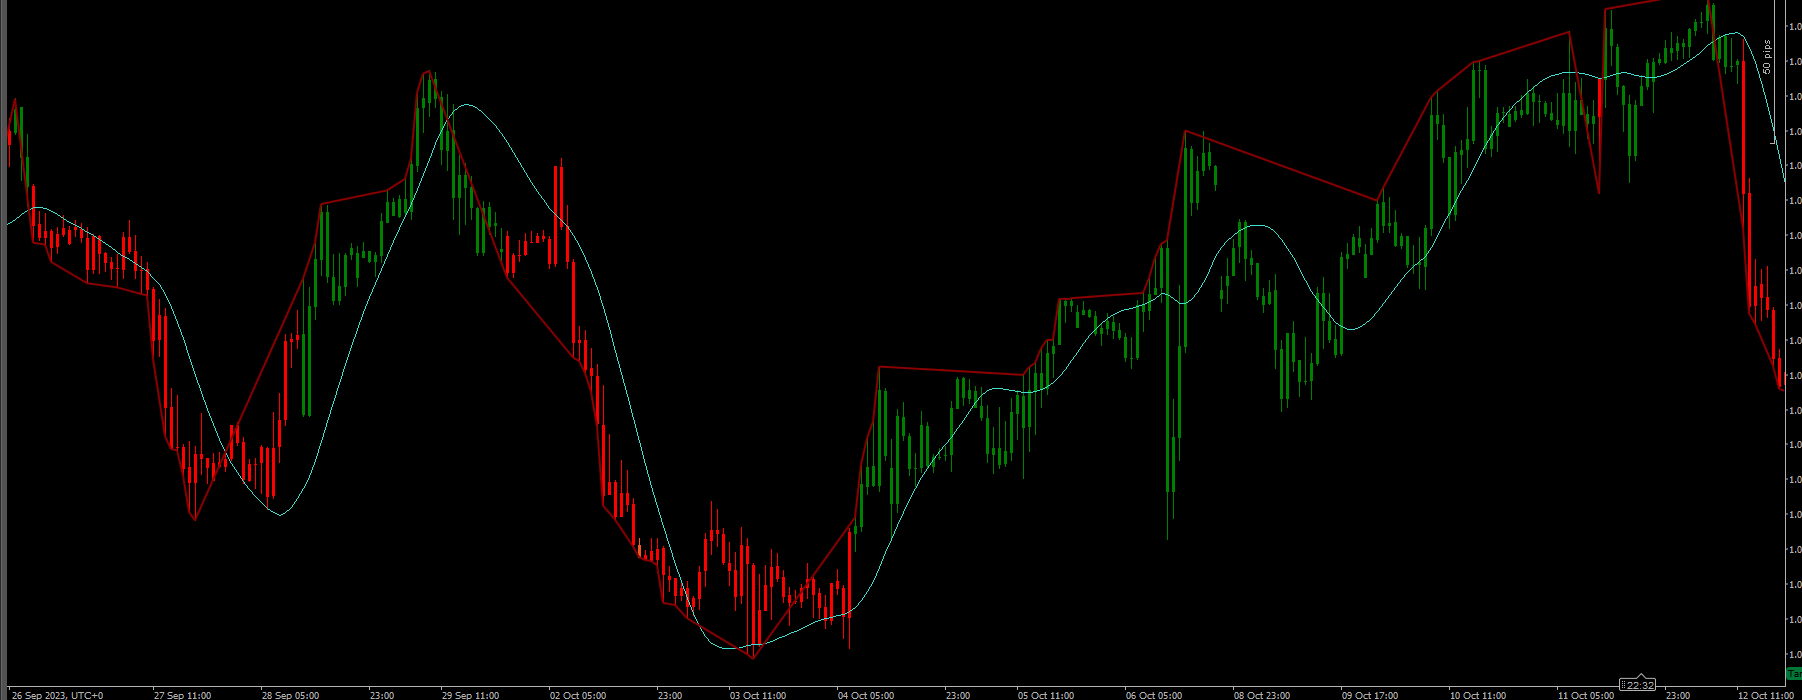
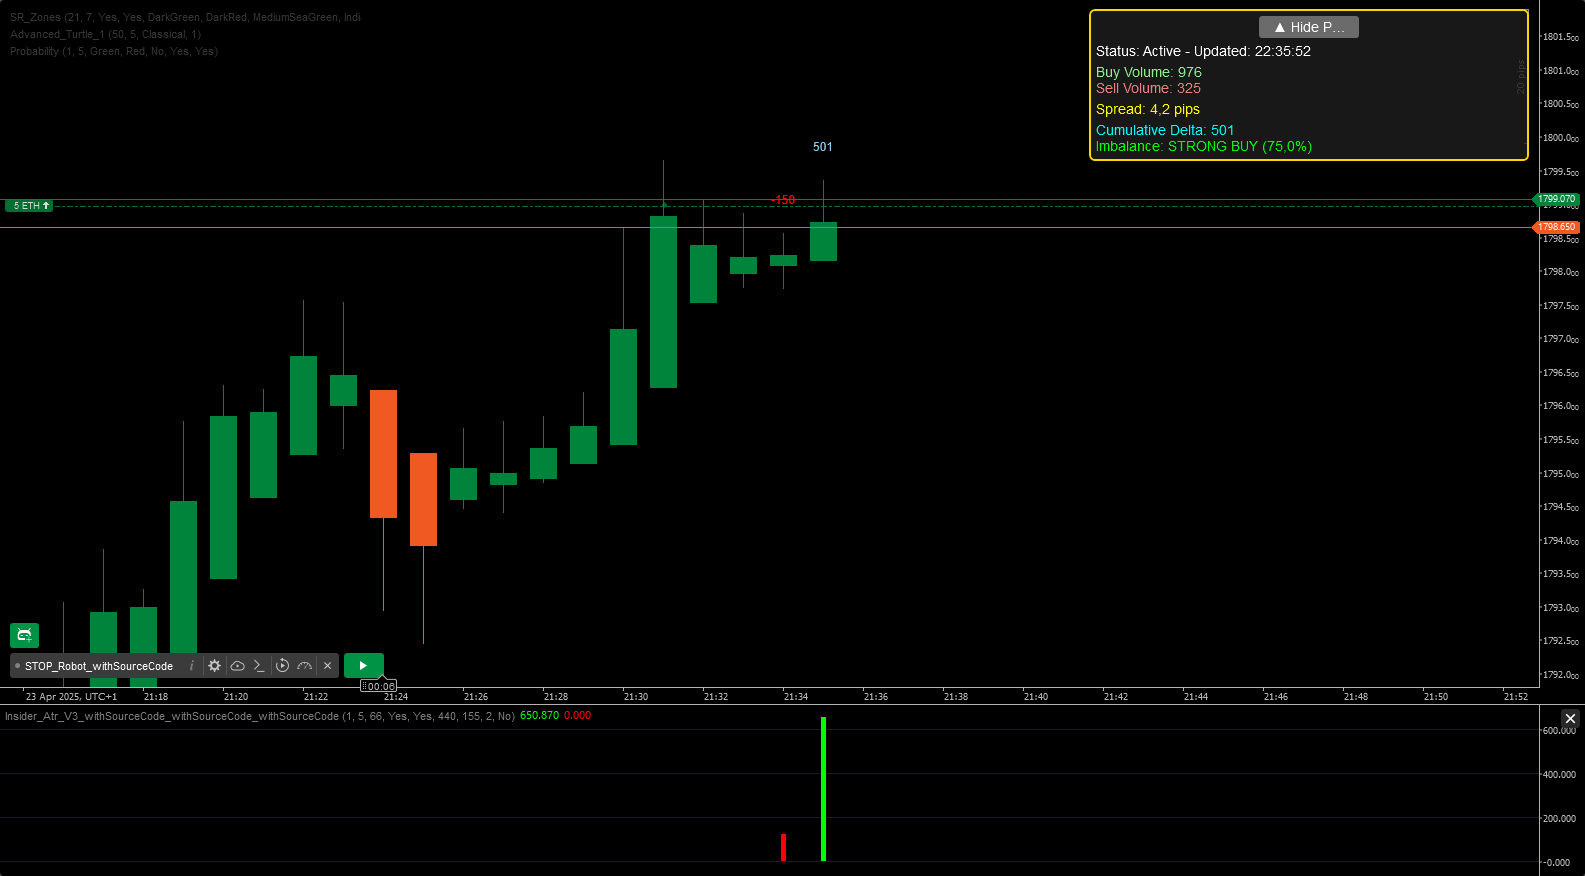
B. Visual Elements
- Colored Bars
- Blue = Strong Bullish
- Light Blue = Weak Bullish
- Red = Strong Bearish
- Coral = Weak Bearish
- Gray = No Trend
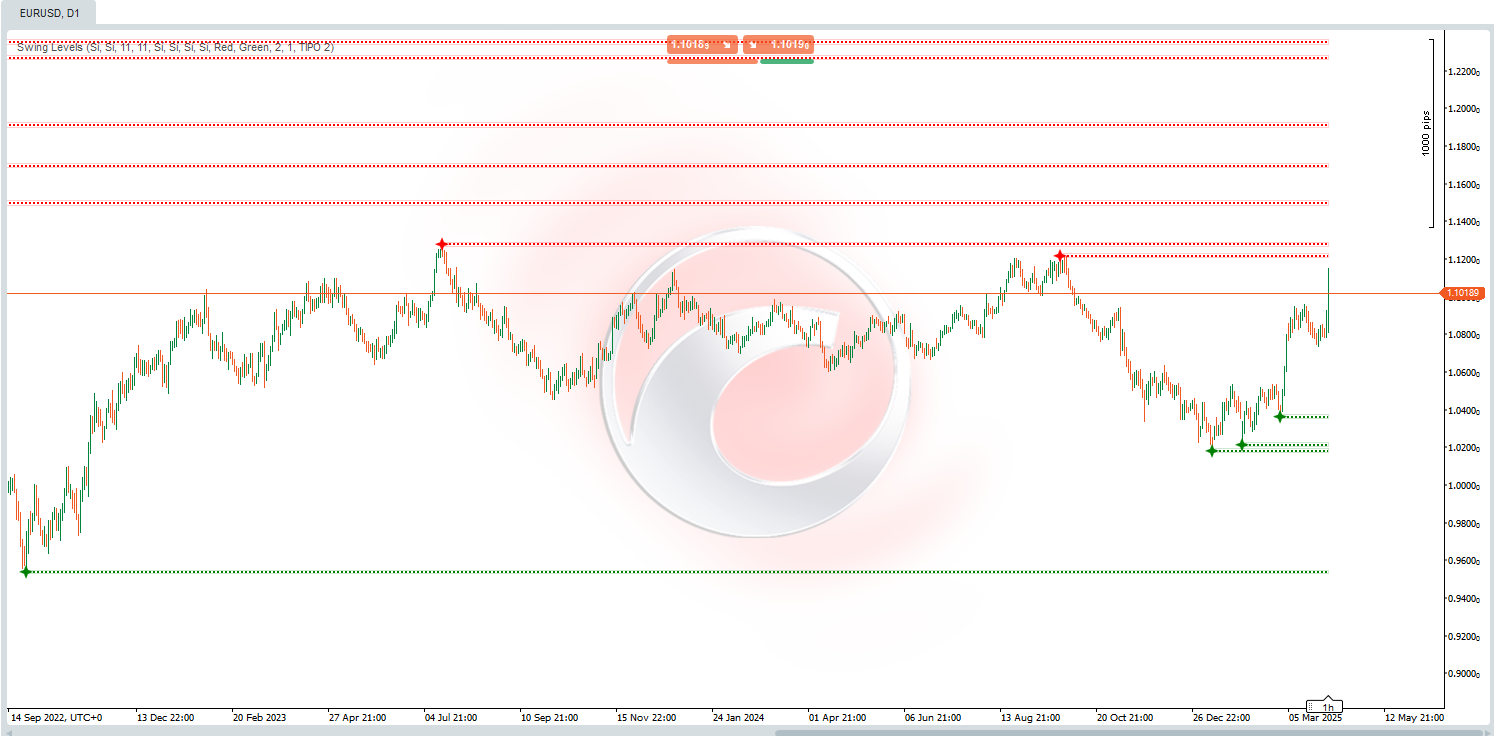
- Mini Trend Lines (optional)
- Shows high/low of each bar
- Arrows (optional)
- Green Up Arrow = Buy Signal
- Red Down Arrow = Sell Signal
C. Alert Types
- Sound Alert
- Plays a
.wavfile (default:C:\cAlgo\Sounds\alert2.wav) - You can change the file path in settings
- Plays a
- On-Chart Notifications
- Shows text alerts at the top/bottom of the chart
- Email Alerts (optional)
- Sends signals to your email (must configure email in cTrader first)
3. How Signals Are Generated
A BUY signal triggers when:
✅ Price is above both EMA (Fast > Slow)
✅ RSI > 50 (bullish momentum)
✅ MACD histogram > 0
✅ Price jumps up sharply (more than 0.5 x ATR)
A SELL signal triggers when:
✅ Price is below both EMA (Fast < Slow)
✅ RSI < 50 (bearish momentum)
✅ MACD histogram < 0
✅ Price drops sharply (more than 0.5 x ATR)
More from this author


.jpeg)
You may also like
.jpg)


.jpg)