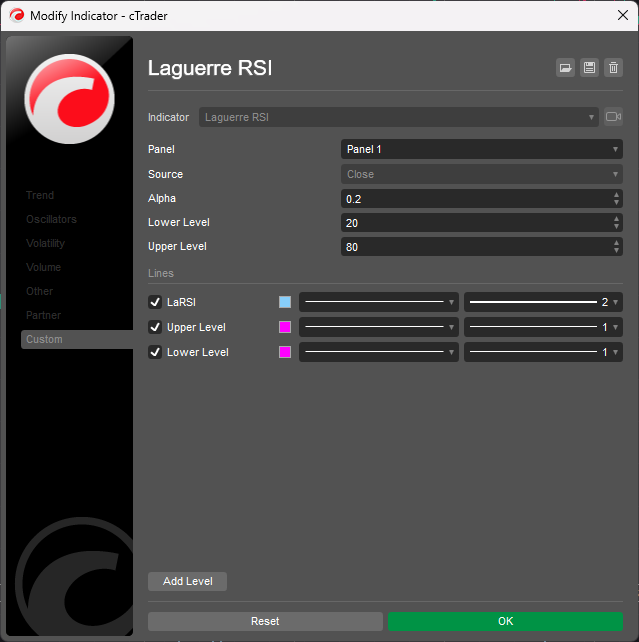
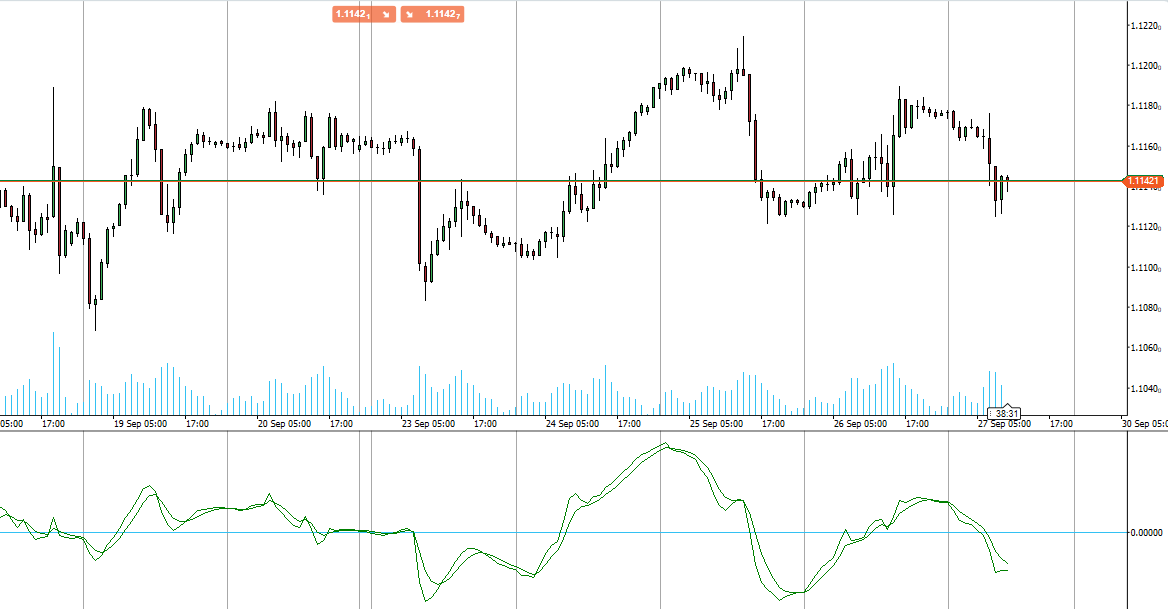
Laguerre RSI
"Laguerre RSI" logo
5.0
03/09/2025
509
Desktop
Since 03/10/2024
Sales
1
Free installs
5131
"Laguerre RSI" uploaded image"Laguerre RSI" uploaded image

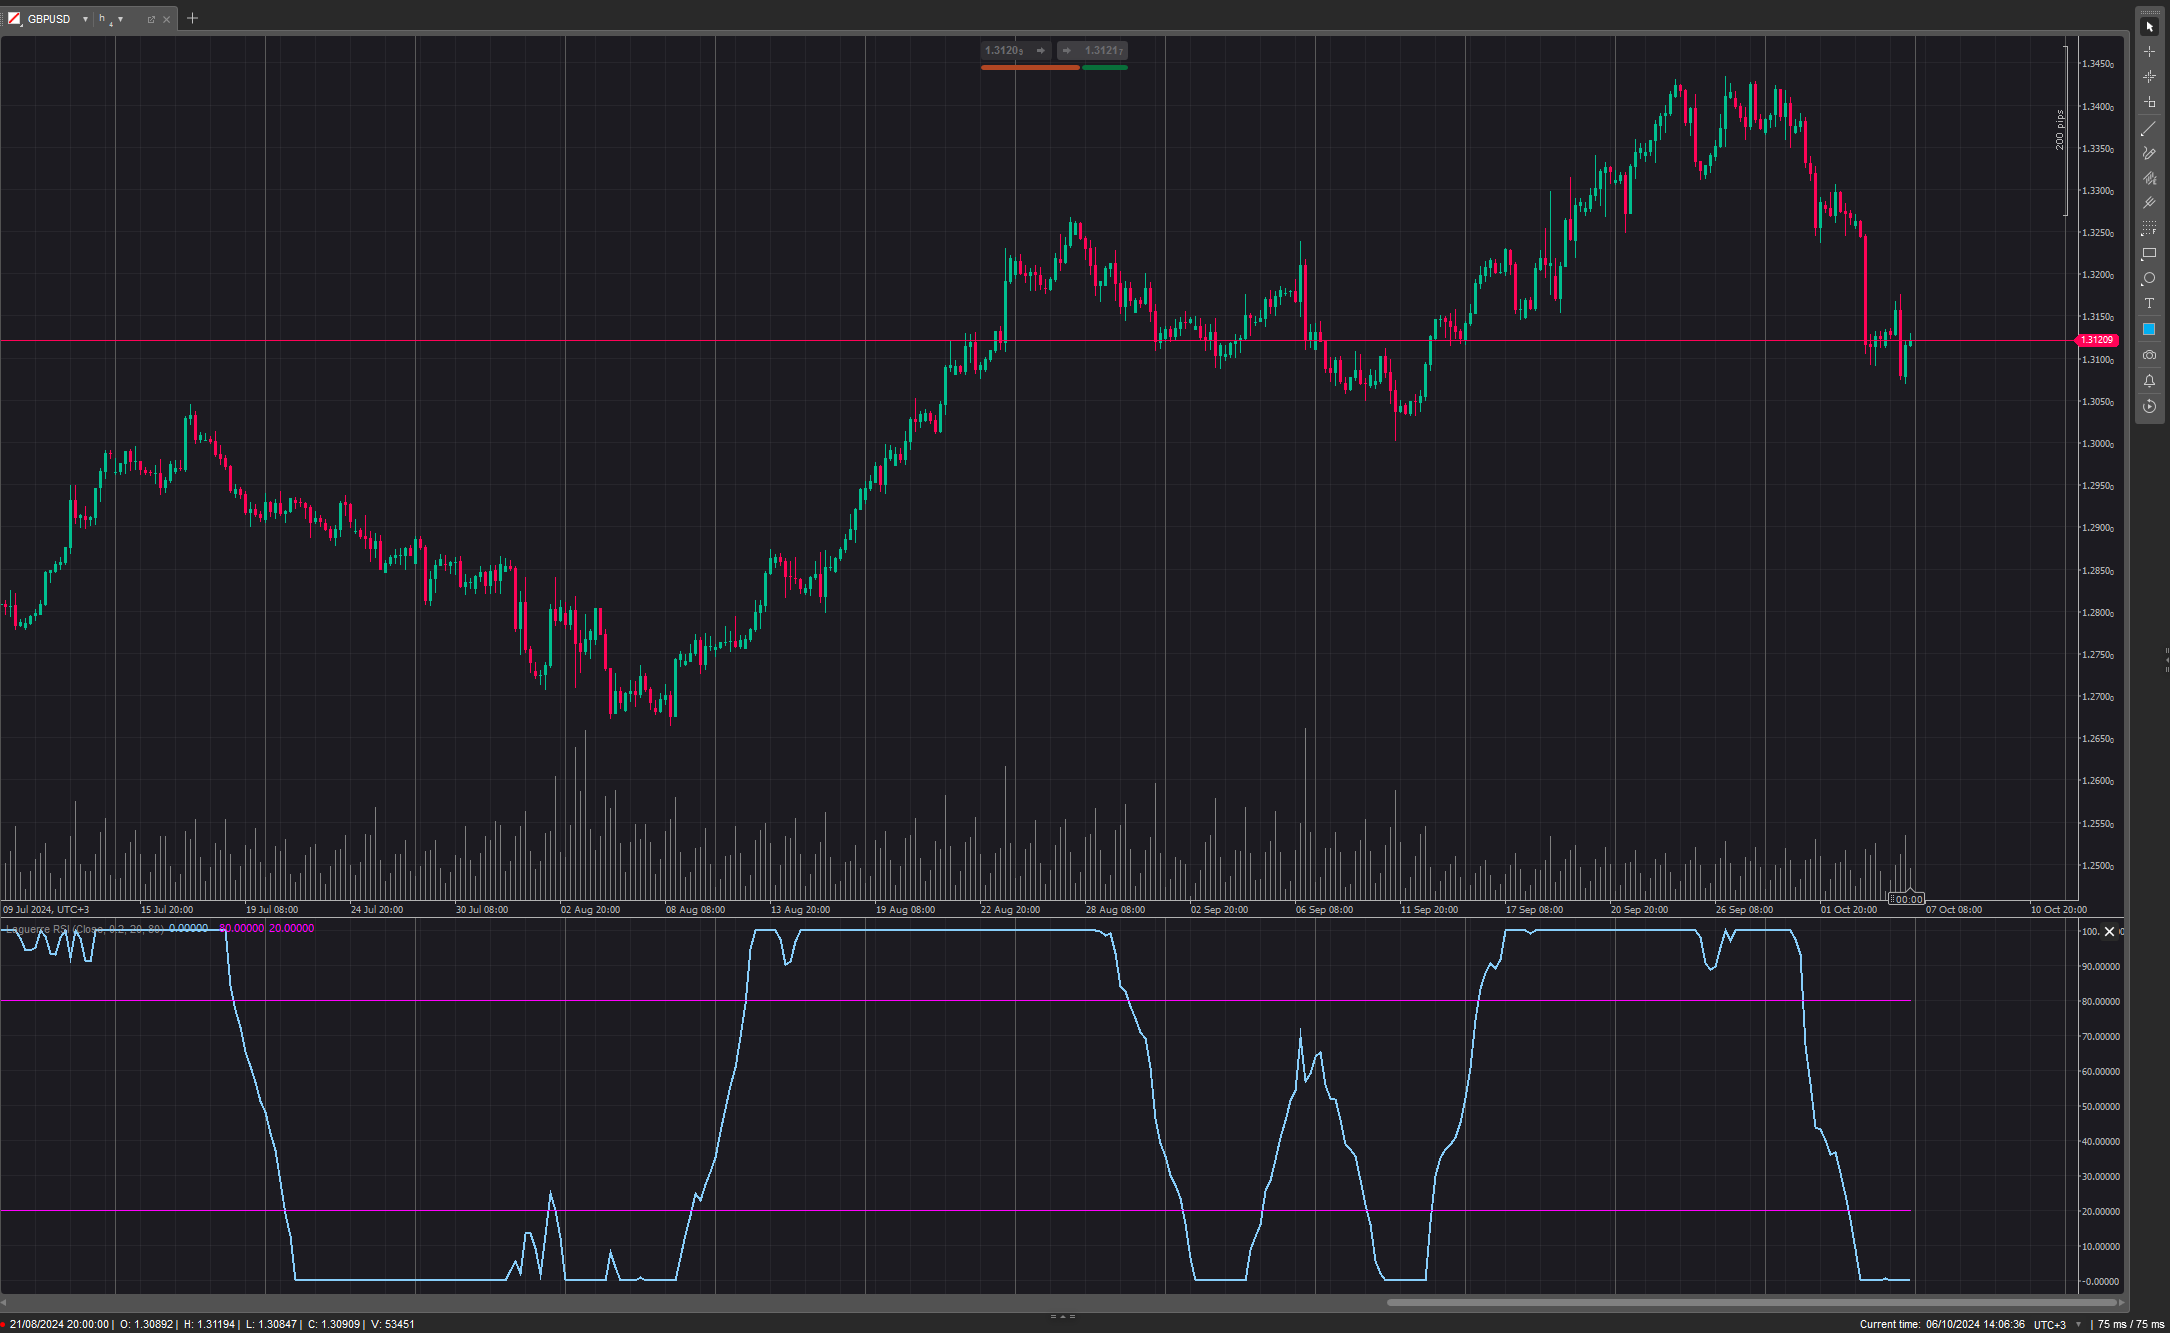
Laguerre RSI is based on John EHLERS' Laguerre Filter to avoid the noise of RSI.

Change the alpha coefficient to increase/decrease lag and smoothness.
the
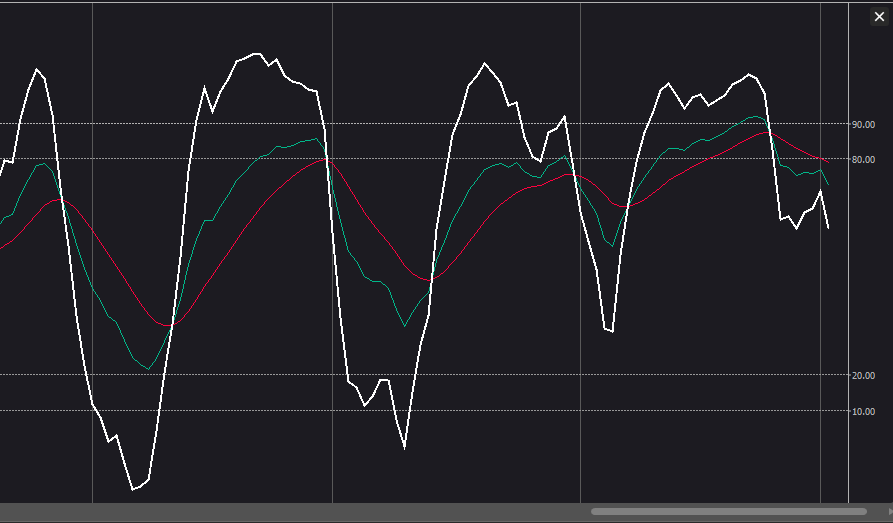
Buy when Laguerre RSI crosses upwards above 20.
Sell when Laguerre RSI crosses down below 80.

While the indicator runs flat above 80, an uptrend is strong.
While the indicator runs flat below the 20 level, it means that a downtrend is strong.

More from this author
Top-rated
Free
Indicator
ATR
Supertrend
PMAX
It's a combination of two trailing stop loss and the other one is well-known ATR-based SuperTrend.
cBot
VWAP
RSI
Breakout
+5
Investion X V1.9 - Intelligent Filter-Based Trading System
Trading system combining martingale strategy with multi-layered technical analysis and comprehensive protection features
MultiTimeFrame Moving Averages
3 moving averages with different periods and different time frames.
Indicator
Indices
AI
Machine Learning Momentum Index
The Machine Learning Momentum Index (MLMI) represents the next step in oscillator trading.
Indicator
RSI
Indices
StochasticRSI
Stochastic RSI (StochRSI) is a technical indicator used to measure the strength and weakness of the RSI.
KDJ
The KDJ oscillator display consists of 3 lines (K, D and J - hence the name of the display) and 2 levels.
Indicator
Breakout
Forex
On Balance Volume
On Balance Volume (OBV) measures buying and selling pressure as a cumulative indicator.
Quantitative Qualitative Estimation
The QQE (Quantitative Qualitative Estimation) Weighted Oscillator improves its original version by weighting the RSI.
Indicator
Breakout
Stocks
Signal
Darvas Box
The Darvas Box involves identifying "boxes" or trading ranges where a stock's price consolidates before breaking out.
Chaikin Money Flow
Chaikin money flow's primary purpose is to distinguish between periods of accumulation and distribution of a security.
Indicator
Indices
Breakout
Stocks
+3
Ichimoku Cloud Indicator
The Ichimoku Cloud is a comprehensive technical analysis system developed by Japanese journalist Goichi Hosoda
cBot
Grid
Martingale
Investion Basic
This is a basic martingale bot without an indicator. For long and short trading options at the same bot.
You may also like
Indicator
NAS100
NZDUSD
XAUUSD
+7
Bayesian Price Projection Model
Bayesian theory** to forecast a future price while providing **uncertainty ranges** that represent upper and lower bound
Indicator
ATR
Stocks
Commodities
+2
LevelMaster SR
LevelMaster S/R: Pinpoint key support & resistance zones with precision. Perfect for traders of all levels Trade smarter
Time To Break Even Lite Version
This is the trial version of Time To Break Even, which help you time your trade entry.
Range 10 Rsi
RSI Scalping cBot: quick‑fire trades on choppy symbols.
Indicator
Breakout
PDHL
PDHL - Previous Day High&Low
Indicator
NAS100
NZDUSD
Breakout
+12
Supertrend - Multi-Timeframe
Supertrend - Multi-Timeframe Indicator
Indicator
NAS100
Indices
NZDUSD
+9
RT True Strength Index
Enhance trading with TSI! Use the True Strength Index for clear insights into market momentum and trend strength.
Tiny_Aim_Trainer
trading stress-relief “mini-game”
Indicator
VWAP
RSI
XAUUSD
+9
Turtle Soup ICT Strategy
Turtle Soup ICT Strategy – Detect liquidity traps & trade smart money moves with precision on cTrader.
LT Flexible Volume Profile
Flexible Volume Profile, designed with performance in mind.
Precio Promedio Ponderado por Volumen
VWAP (Volume Weighted Average Price, Precio Promedio Ponderado por Volumen)
Daily Sessions HighLow Helper
Shows daily and sessions highs / lows and session boxes, everything configurable
[Stellar Strategies] BOS Trend 1.0
[Stellar Strategies] BOS Trend: Premium multi-timeframe BOS indicator for precision trend analysis.📈📉
VWAP Tabajara
VWAP Tabajara
E7 Volume Profile
E7 Volume Profile, more modern look and feel.
Indicator
Grid
NAS100
NZDUSD
+15
RangeBoxLevel
This technical analysis indicator provides information on market sentiment, trend and price levels....
MMXM Structure by Ludwig
MMXM Structure by LudwigICT – Professional Market Structure Mapping Tool
IR Open Connector
This indicator connects the opening prices of higher timeframe candles (Daily, Weekly, Monthly, or