This OHLC PRO by LudwigICT indicator is a multi-feature chart overlay tool designed to give a professional, information-rich visualization on your cTrader chart.
Here’s a breakdown of what it does:
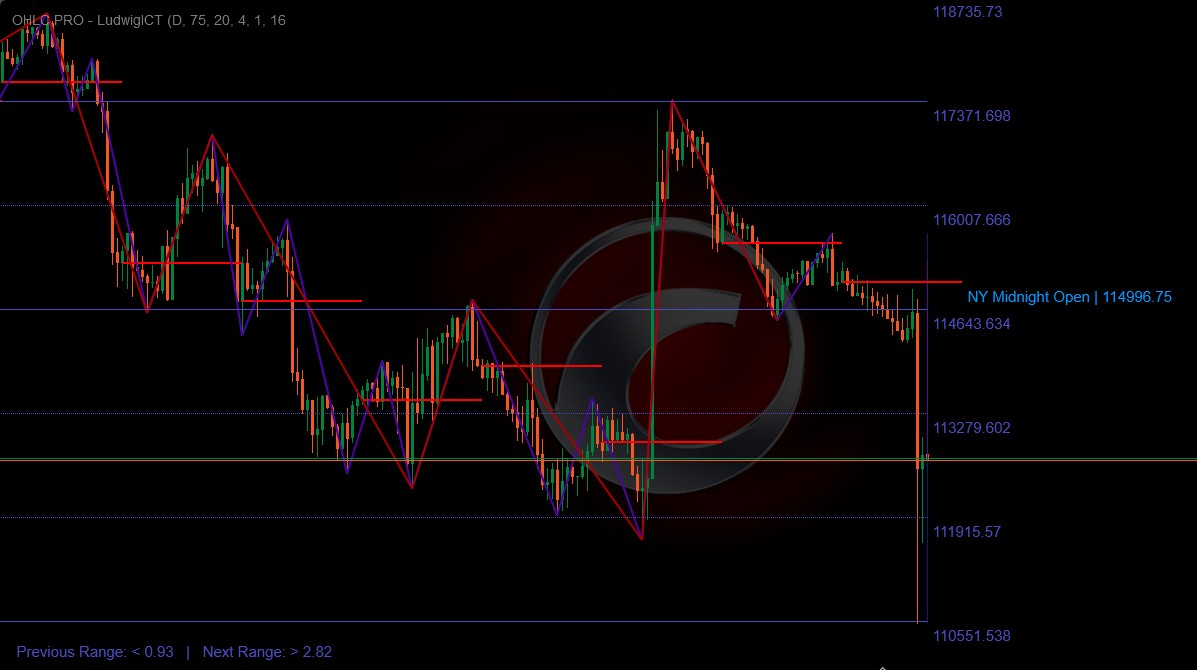
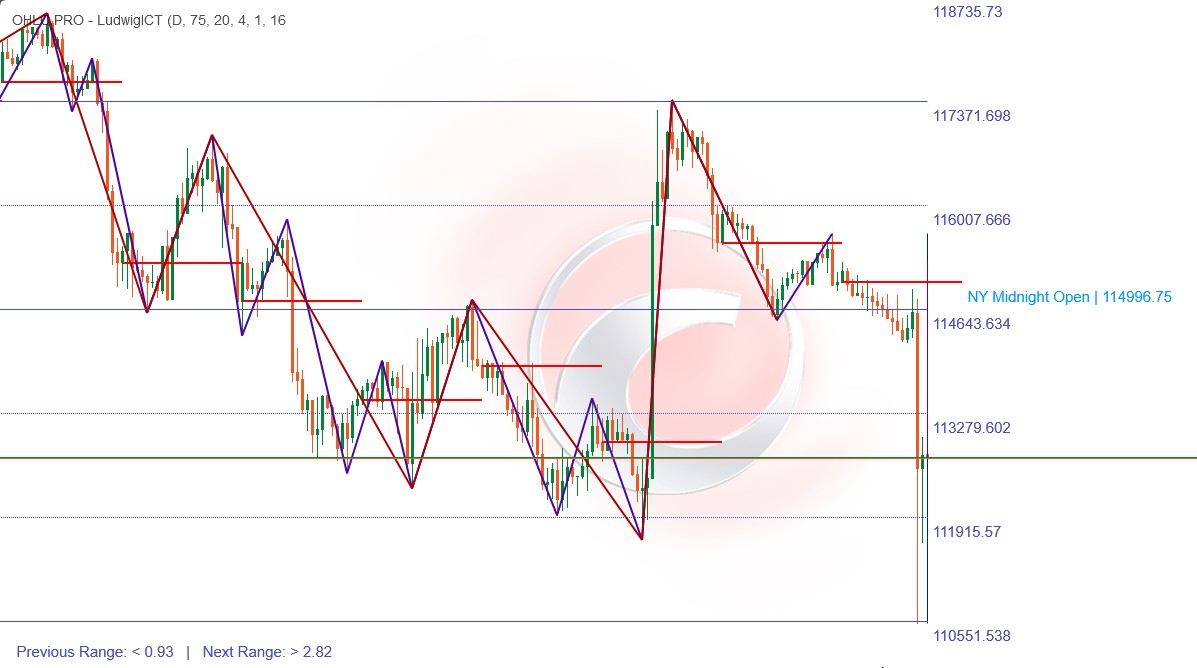
🔹 Core Function: OHLC Overlay
- Draws custom OHLC (Open, High, Low, Close) bars on your chart.
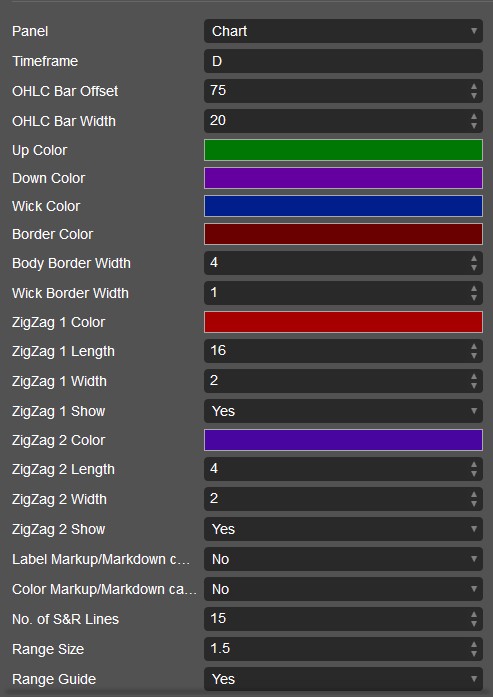
- You can set:
- Which timeframe OHLC to use (Daily, Weekly, Monthly, or intraday like H1, M15, etc.).
- Bar offset (distance from current candles).
- Bar width, wick, borders, and custom colors.
- Effectively, you get “reference candles” from higher timeframes placed on your current chart.
🔹 Triple-M Setup (Bullish/Bearish Signals)
- Detects a pattern of consecutive higher lows (bullish) or lower highs (bearish).
- When detected:
- Can place triangle icons (up or down) on the candles.
- Can also recolor bars to show momentum shift.
- This acts like a momentum structure shift signal.
🔹 Dual ZigZag Tools
- Two independent ZigZag overlays:
- ZigZag #1 (longer length, e.g. swing structure).
- ZigZag #2 (shorter length, e.g. micro swings).
- Highlights market swings for structure, trend, and breakout analysis.
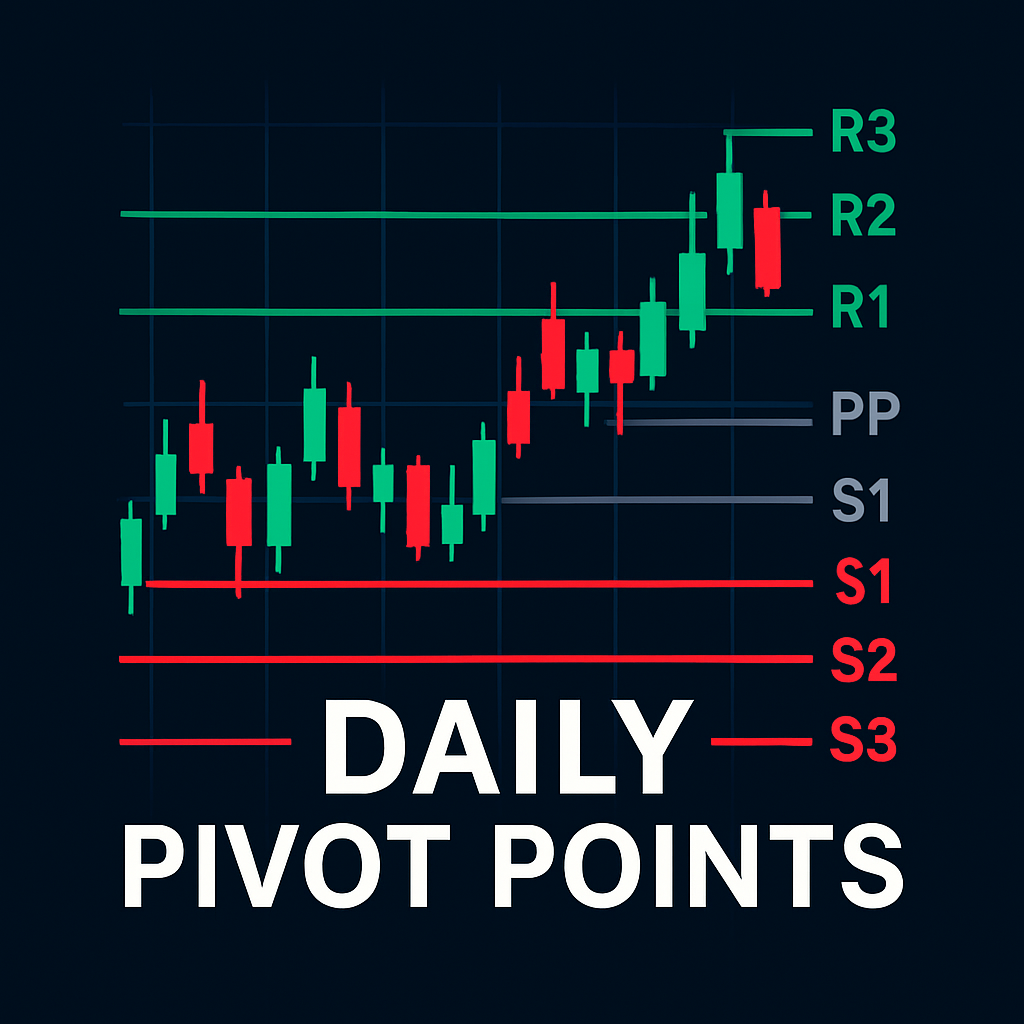
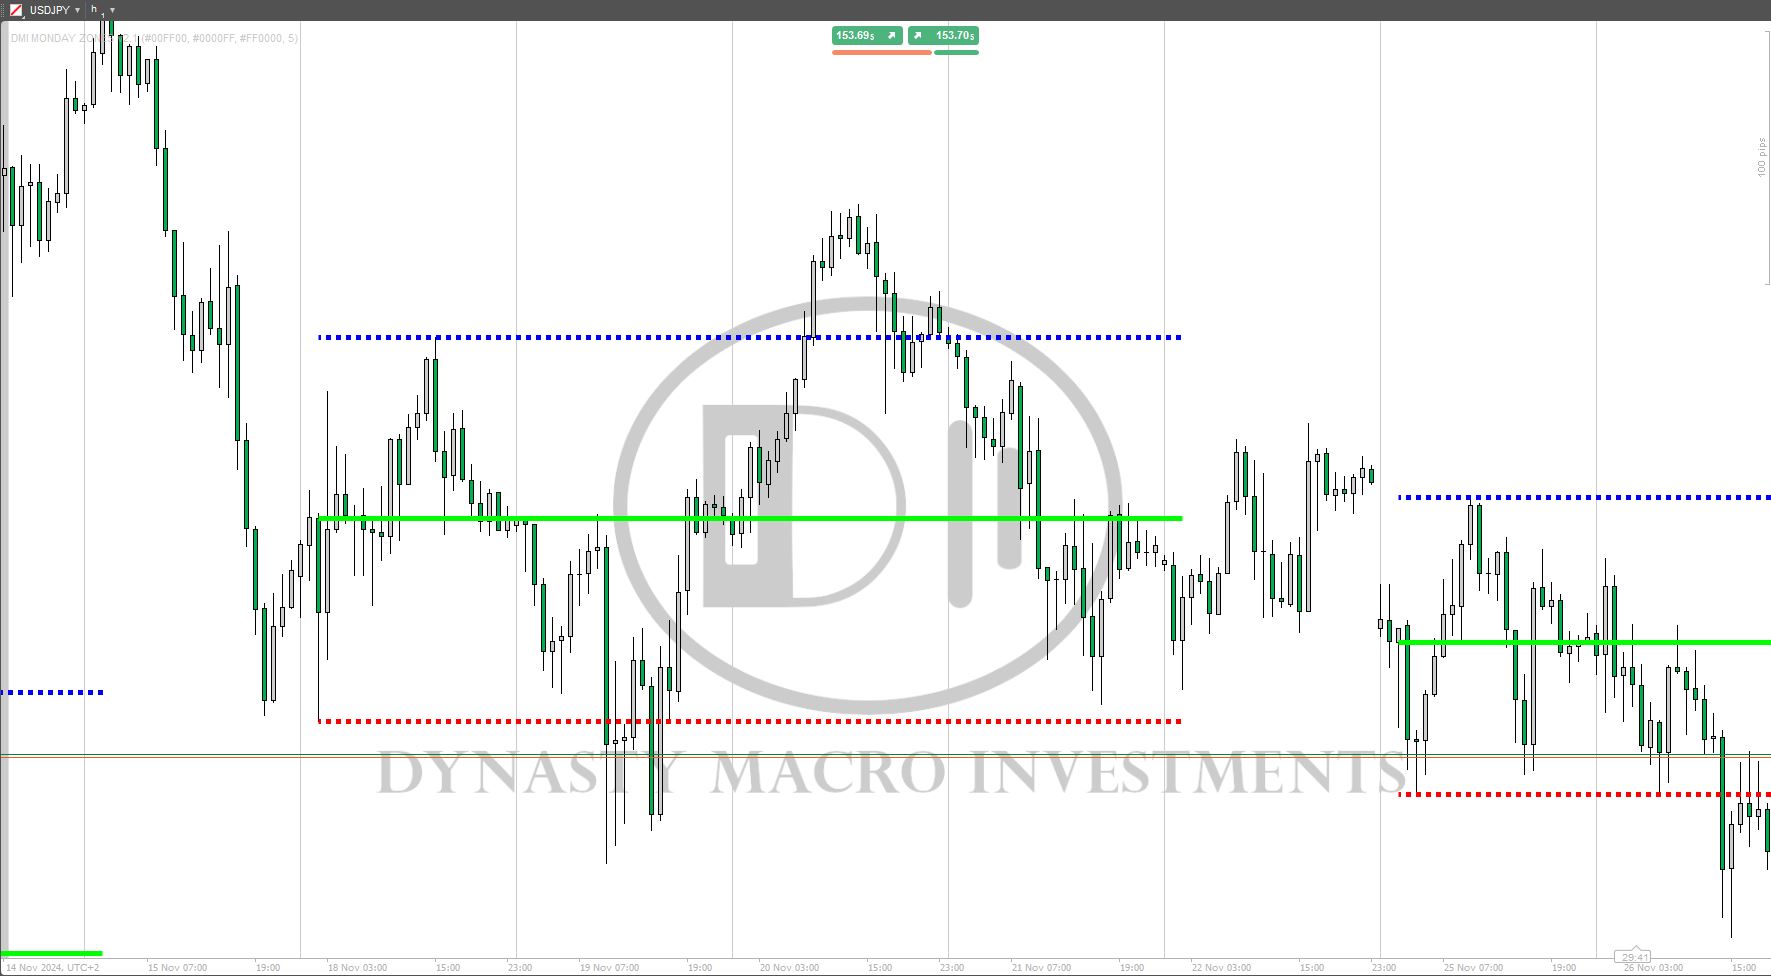
🔹 Gann Support & Resistance
- Uses a Gann number table + ATR logic to calculate S/R levels.
- Plots multiple support/resistance lines above and below price.
- Lines can be styled (solid, dotted, extended left, etc.).
- Labels levels with price values.
- Also gives Range Guides:
- “Previous Range” vs. “Next Range” relative to ATR.
- Helps forecast expansion or contraction zones.
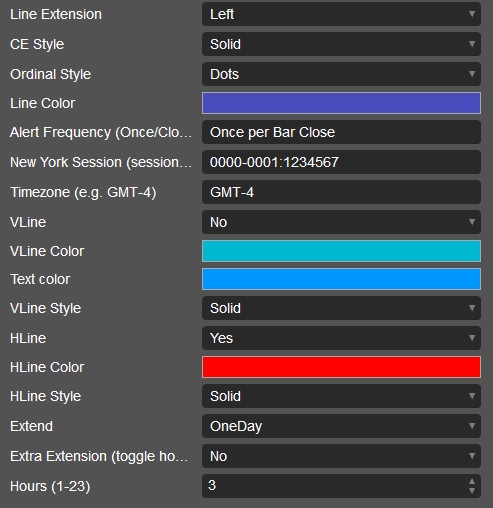
🔹 New York Midnight Levels
- Automatically detects New York Session midnight open price.
- Draws:
- Horizontal line at NY midnight open price.
- Vertical line at session start.
- Labels showing “NY Midnight Open | price”.
- You can extend these lines for 1 or 2 days, or add extra hours.
- Useful for ICT-style trading (New York session bias, equilibrium points, etc.).
🔹 Customization & Alerts
- Every feature has parameters in dropdowns:
- Colors, styles, line extensions, number of lines, etc.
- Alerts are supported (though mainly via chart visuals—alert frequency param is there).
- Clean removal on indicator close (so your chart doesn’t stay cluttered).
✅ In short:
This indicator is a multi-purpose price action tool. It combines:
- Higher timeframe OHLC candles
- Momentum pattern signals (Triple-M)
- Two ZigZag structures
- Gann S/R levels + range guides
- New York session midnight open markers
It’s made for structure, session, and level-based trading, especially useful for ICT-style or price action traders.
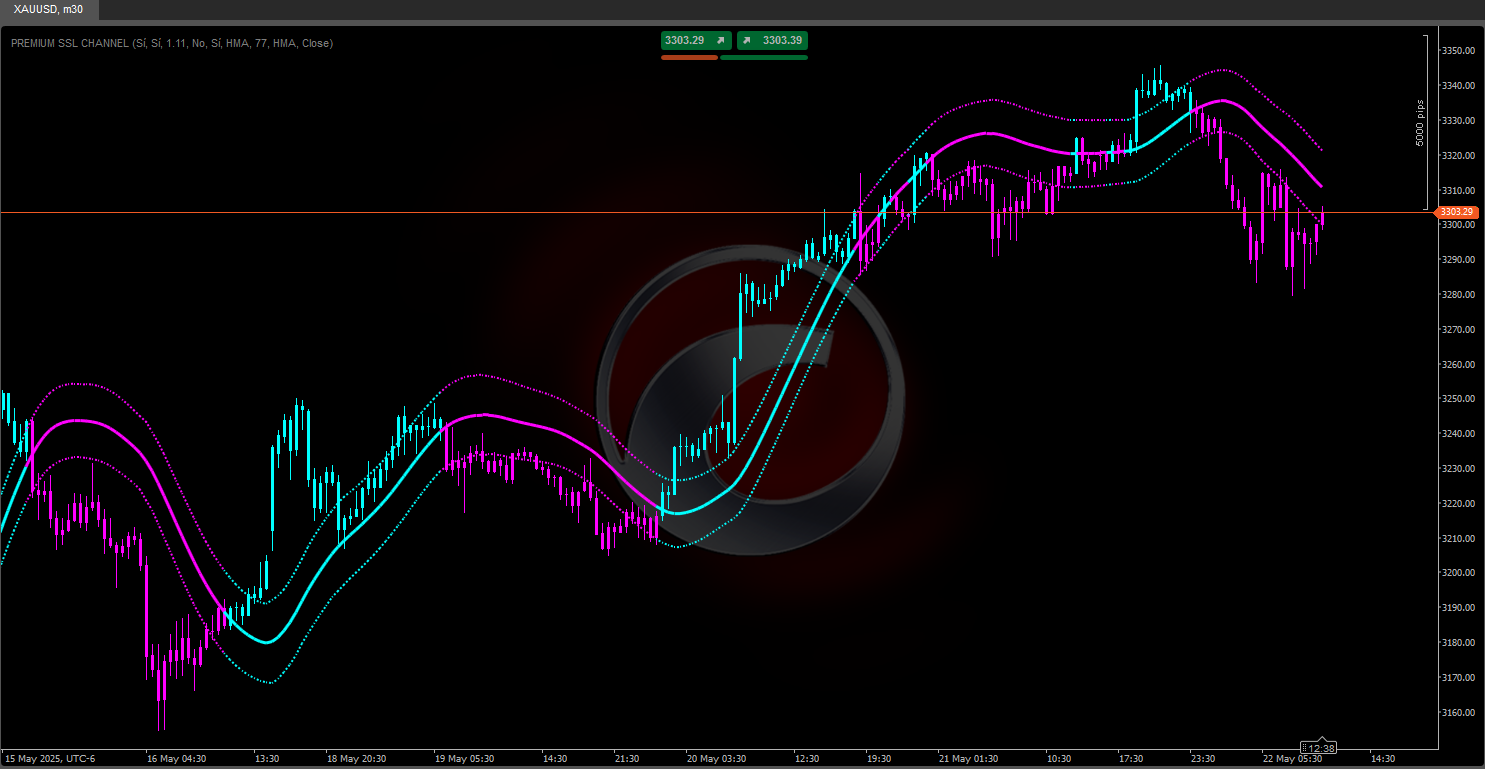
I explain how you could practically use it when trading XAU/USD
🔹 Practical Trading Use (Gold with OHLC PRO)
1. Higher Timeframe OHLC Overlay
- Example: Plot Daily OHLC while trading on M5/M15.
- You’ll see yesterday’s candle “inside” your intraday chart.
- Usage:
- Price approaching previous day’s high/low = liquidity hunt area.
- Daily open/close = bias filter (above = bullish, below = bearish).
- Helps you trade within the daily range.
👉 On gold, NY session often raids the previous day’s high/low before reversing.
2. Triple-M Signals
- The Triple-M pattern (series of rising lows or falling highs) = short-term momentum.
- Usage:
- Bullish Triple-M near support (HTF low or NY midnight open) → possible long scalp.
- Bearish Triple-M near resistance (HTF high or Gann level) → possible short scalp.
- Can color bars for fast visual recognition in fast gold moves.
👉 Works well for sniper entries on M1–M5 when aligned with HTF bias.
3. Dual ZigZag
- ZigZag #1 (longer length) = swing structure.
- ZigZag #2 (shorter length) = micro structure.
- Usage:
- Identify market structure breaks (BOS/CHOCH).
- Trade only in the direction of the bigger ZigZag (#1).
- Use smaller ZigZag (#2) for entry confirmation.
👉 Example: Daily bias bullish → wait for ZigZag #2 shift bullish near HTF support.
4. Gann Support & Resistance
- Generates a grid of mathematical S/R levels.
- Usage:
- If price is consolidating, levels mark likely expansion breakout points.
- Combine with ATR range guide:
- "Previous Range" small → expect volatility expansion.
- "Next Range" high → strong breakout level ahead.
👉 On gold, Gann levels often align with round numbers (e.g. 2400, 2420, 2435).
5. New York Midnight Open
- This is one of the most powerful ICT tools for gold.
- Usage:
- Price relative to NY midnight open = directional bias.
- If price stays above midnight open → bullish NY session.
- If below → bearish bias.
- Horizontal line acts as equilibrium (50%) reference.
- Watch for liquidity sweeps around this level in London/NY killzones.
👉 Example:
NY midnight open = 2405.
- If London runs price down to 2398 and NY reclaims 2405 → strong long setup.
🔑 Putting It Together (Example Setup)
- Start NY session:
- Plot Daily OHLC.
- Note NY midnight open.
- Watch Gann levels nearby.
- Wait for liquidity grab (raid of Daily High/Low or Gann SR).
- Check Triple-M / ZigZag #2 for micro bullish/bearish confirmation.
- Enter with stop behind liquidity sweep.
- Target opposite side of range or next Gann/HTF level.
✅ In short:
- Daily OHLC + NY Midnight = bias filter.
- ZigZag + Triple-M = entry timing.
- Gann + Range Guide = profit targets & expansion signals.
This indicator basically gives you all the ICT-style tools in one package for XAU/USD.
If you have any questions or run into any issues, feel free to contact me. I'm happy to help You!
Disclaimer:
By using my algorithms, you acknowledge that trading involves inherent risks and that past performance does not guarantee future results. It is essential that you have a solid risk management strategy in place and, above all, that you remain disciplined in adhering to stop-loss levels. Failure to manage risk properly can lead to significant losses. I am not responsible for any financial outcomes resulting from the use of these algorithms. Trade responsibly and always follow proper risk management practices.
Bless up! 🙌

.jpg)
.jpg)
.jpg)
.jpg)
.png)
.jpg)
.jpg)
.jpg)