The Volume Profile, Pivot Anchored indicator brings a professional-grade approach to market structure and volume analysis directly into cTrader. Designed for traders who value clarity, precision, and actionable insights, it reveals how trading activity is distributed across price within meaningful swing ranges.
⚡Exclusive Offer – Limited to the First 10 Purchasers!⚡
Unlock the full potential of your trading strategy with this powerful custom indicator, designed to give you a precise edge in the market. This tool has been crafted for serious traders who want clear, actionable signals and improved decision-making when trading XAU/USD and other Forex pairs.
🚀 Why Get It Now:
Available at a special launch price – only for the first 10 traders
Gain access to advanced price action insights
Built for high accuracy and reliability
Perfect for both scalping and swing trading
Once 10 copies are sold, this offer will no longer be available at this price. Secure your copy today and take your trading to the next level!
What It Does?
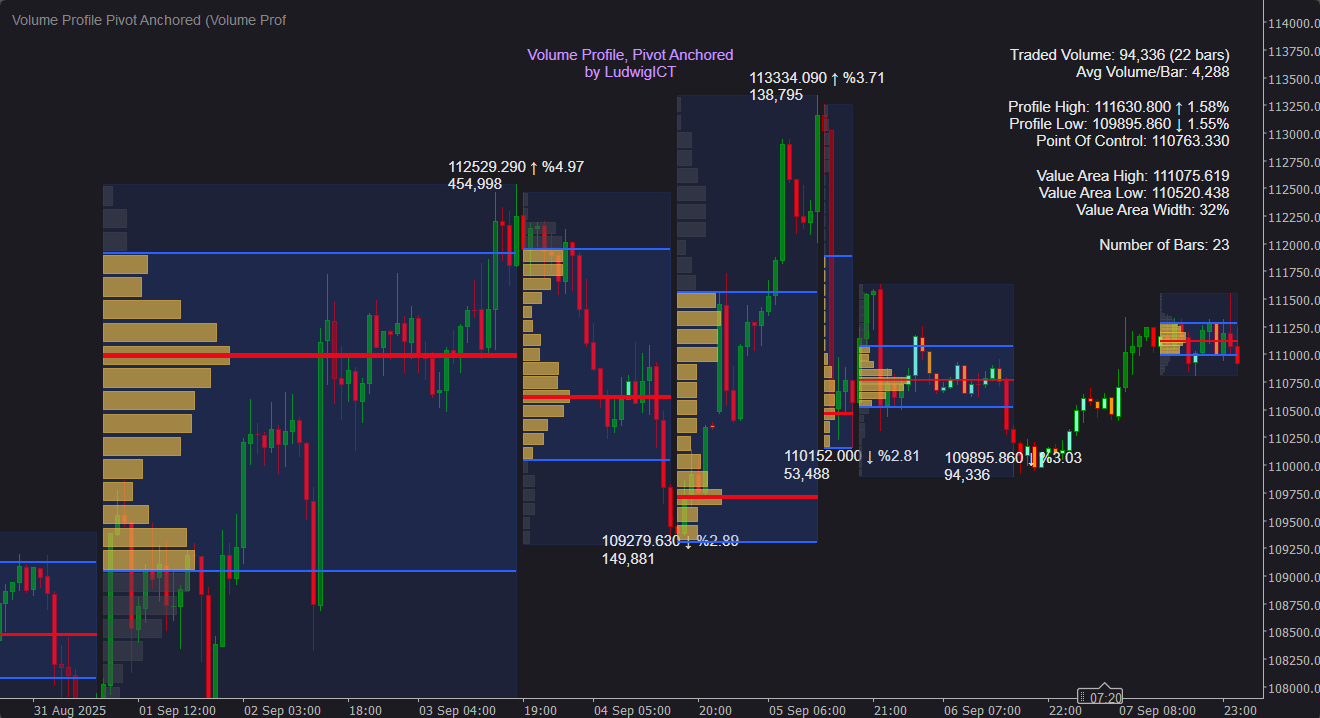
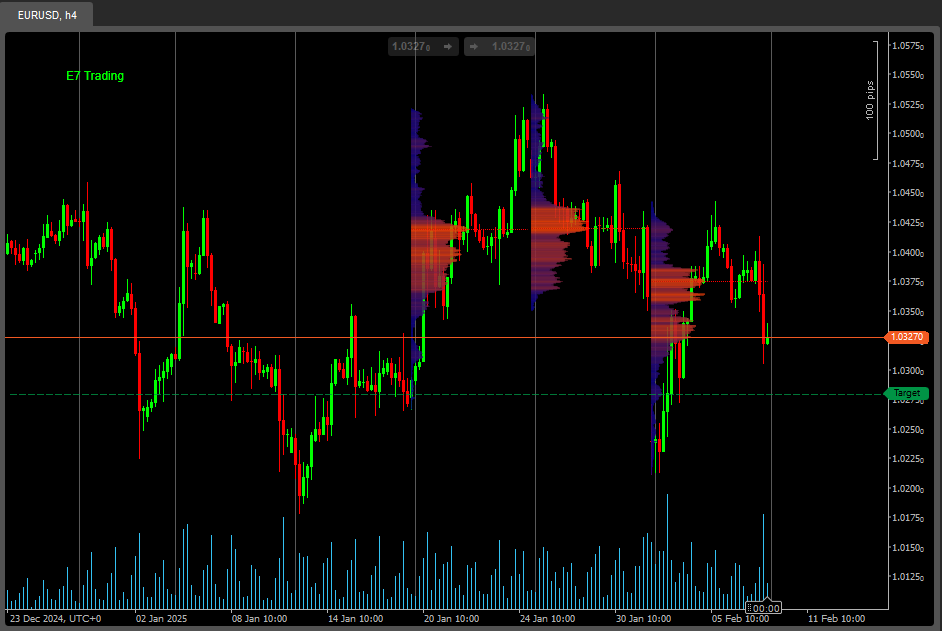
Unlike fixed or session-based profiles, this tool automatically anchors volume profiles to significant pivot highs and lows, dynamically mapping the auction process of each swing. This makes it possible to see where market participants actually committed capital — not just where price happened to move.
✨ Key elements include:
📍 Automatic Pivot Detection – Profiles are built between swing highs and lows, updating as new pivots form.
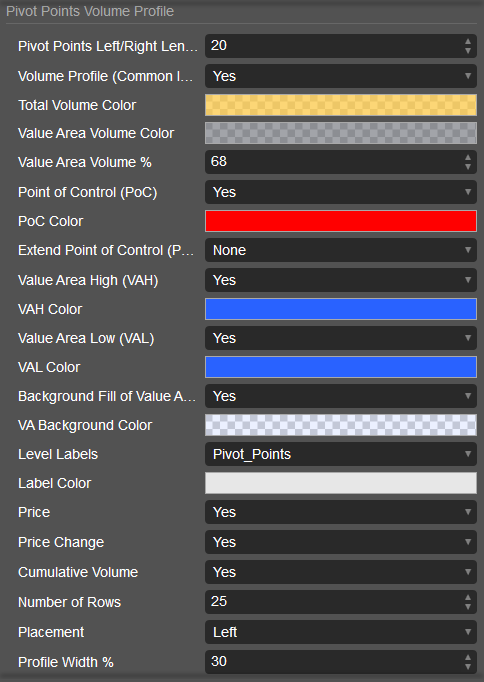
📊 Detailed Volume Distribution – Histograms display how volume is allocated across price, with user-defined resolution and width.
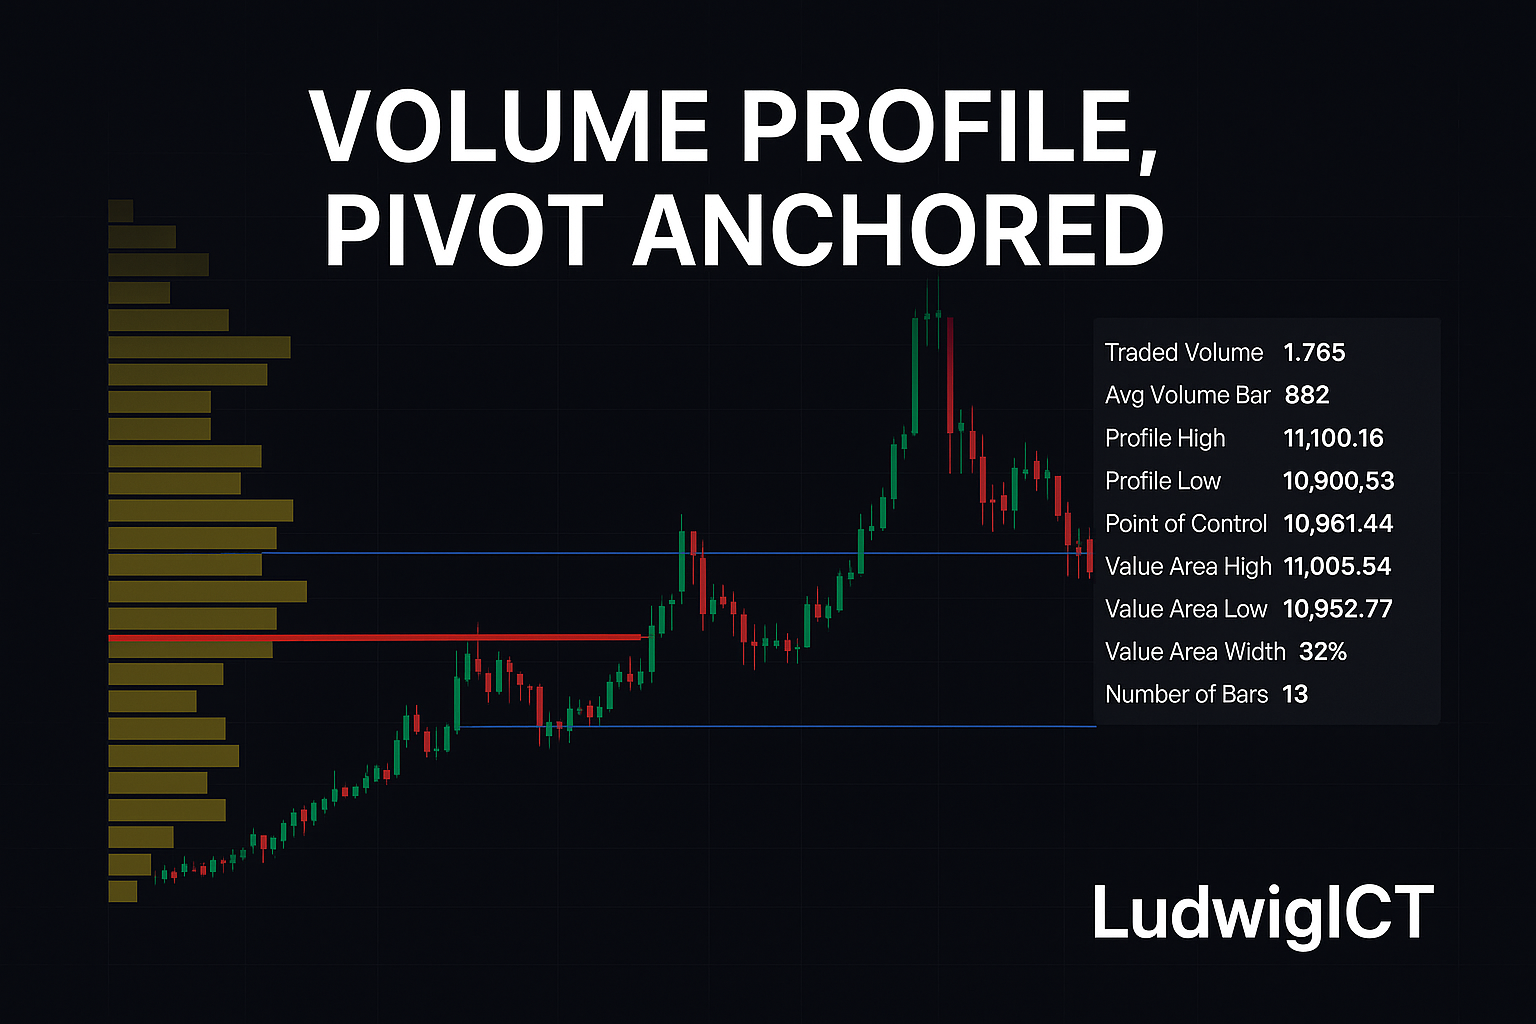
🎯 Value Area & POC Levels – Instant calculation and visualization of Point of Control (POC), Value Area High (VAH), and Value Area Low (VAL).
📈 Developing Profile – A live-updating profile on the current leg provides forward-looking context.
➡️ Extending POC Zones – Project the POC forward until touched or crossed by price, highlighting future reaction zones.
📝 Informative Labels & Tooltips – Price labels, % change, cumulative volume, and a clean statistical panel on hover.
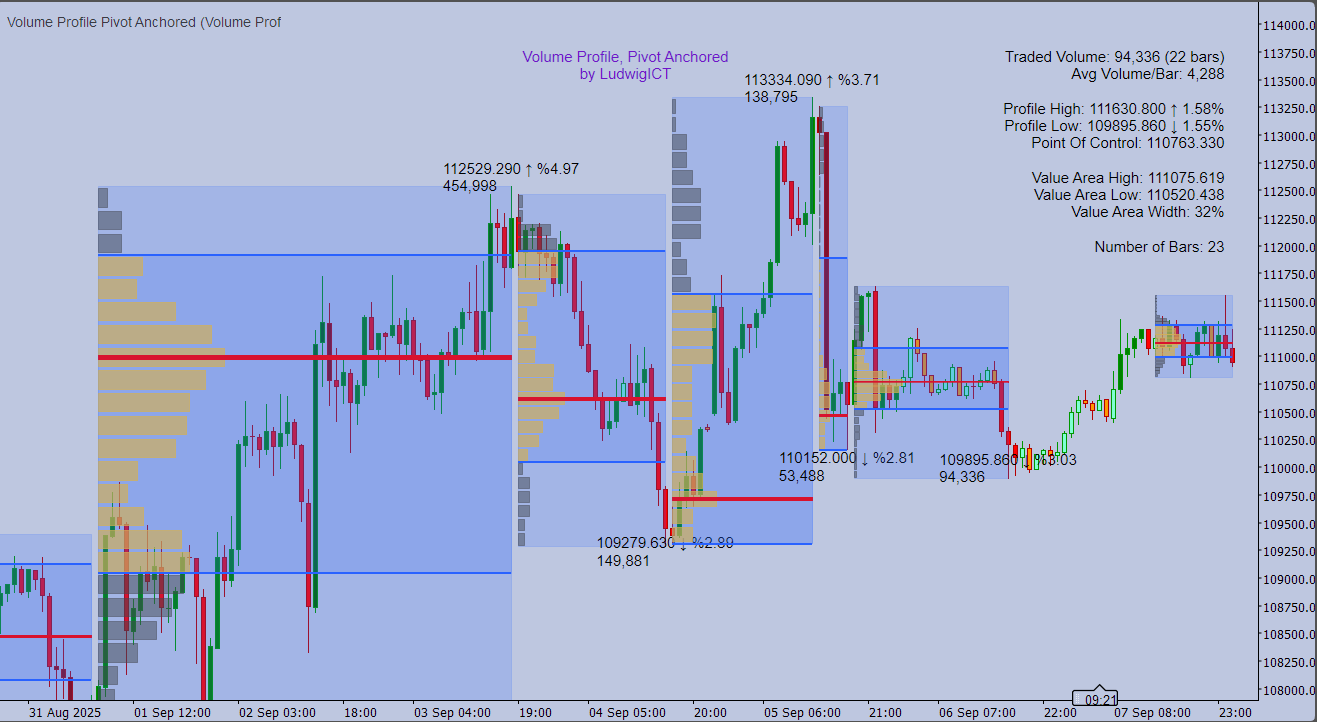
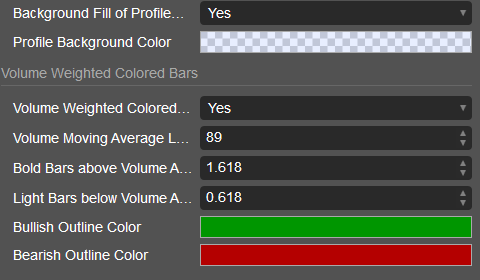
🎨 Volume-Weighted Bar Coloring – Candles shaded by volume intensity for quick pattern recognition.
⚙️ Full Customization – Adjust colors, placement, and display to integrate seamlessly with your chart style.
How to Use
1️⃣ Attach to any chart – works across all timeframes and instruments.
2️⃣ Adjust pivot length – control sensitivity to swing highs/lows (shorter = more profiles, longer = major structure only).
3️⃣ Interpret profiles in context:
• 🎯 POC – price level with the most traded volume, often a magnet.
• 📏 VAH / VAL – boundaries of the value area, powerful support/resistance.
• 🌀 Histogram Shape – identify balance areas, rejection zones, and distribution shifts.
4️⃣ Watch the developing profile – follow how auction structure builds in real time.
5️⃣ Use alerts – get notified when price interacts with POC, VAH, VAL, or when high-volume bars appear.
6️⃣ Apply as a framework – refine entries at volume-based levels, anticipate reversals, and confirm trends through volume structure.
Why Traders Use It
This indicator translates raw volume into meaningful structure. By anchoring profiles to pivots, it adapts to live market dynamics instead of relying on arbitrary session splits. Whether intraday, swing, or positional trading, anchored volume distribution provides deeper clarity for decision making.
Key Parameters at a Glance
⚙️ Pivot Sensitivity – define how aggressively swing points are detected.
📊 Profile Levels & Width – control profile resolution and visibility.
🎯 POC Extension Modes – None, until last bar, until touch, or until cross.
📏 Value Area % – fully adjustable (default 68%).
🎨 Volume Coloring – thresholds for highlighting strong/weak participation.
Volume Profile, Pivot Anchored by LudwigICT is not a generic visualization — it is a structural lens into how markets truly auction. For traders who demand professional tools, it provides a decisive edge in reading the interplay between price and volume.
If you have any questions or run into any issues, feel free to contact me. I'm happy to help You!
Disclaimer:
By using my algorithms, you acknowledge that trading involves inherent risks and that past performance does not guarantee future results. It is essential that you have a solid risk management strategy in place and, above all, that you remain disciplined in adhering to stop-loss levels. Failure to manage risk properly can lead to significant losses. I am not responsible for any financial outcomes resulting from the use of these algorithms. Trade responsibly and always follow proper risk management practices.
Bless up! 🙌
.jpg)
.jpg)
.jpg)
.jpg)

.png)
.jpg)
.jpg)
.jpg)


.jpeg)
!["[Hamster-Coder] Bollinger Bands" logo](https://market-prod-23f4d22-e289.s3.amazonaws.com/1114cb2b-7120-42b3-8f53-dbc26968e6af_Icon300.jpg)