Daily Open Color Zones
13/09/2025
35
Desktop
Since 13/09/2025
Free installs
114
.png)
.png)
.png)
.png)
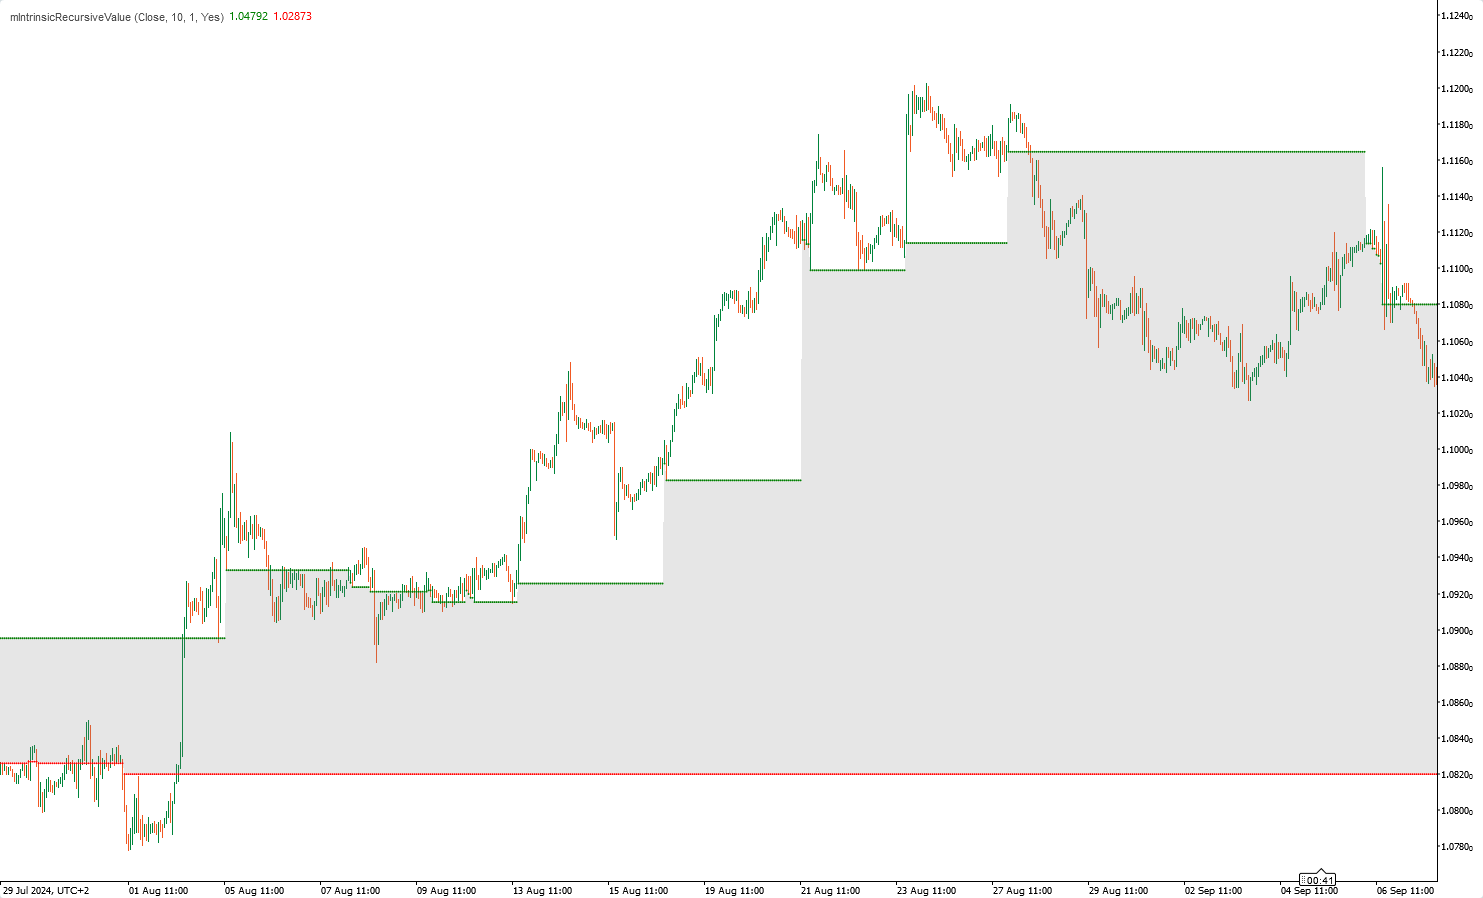
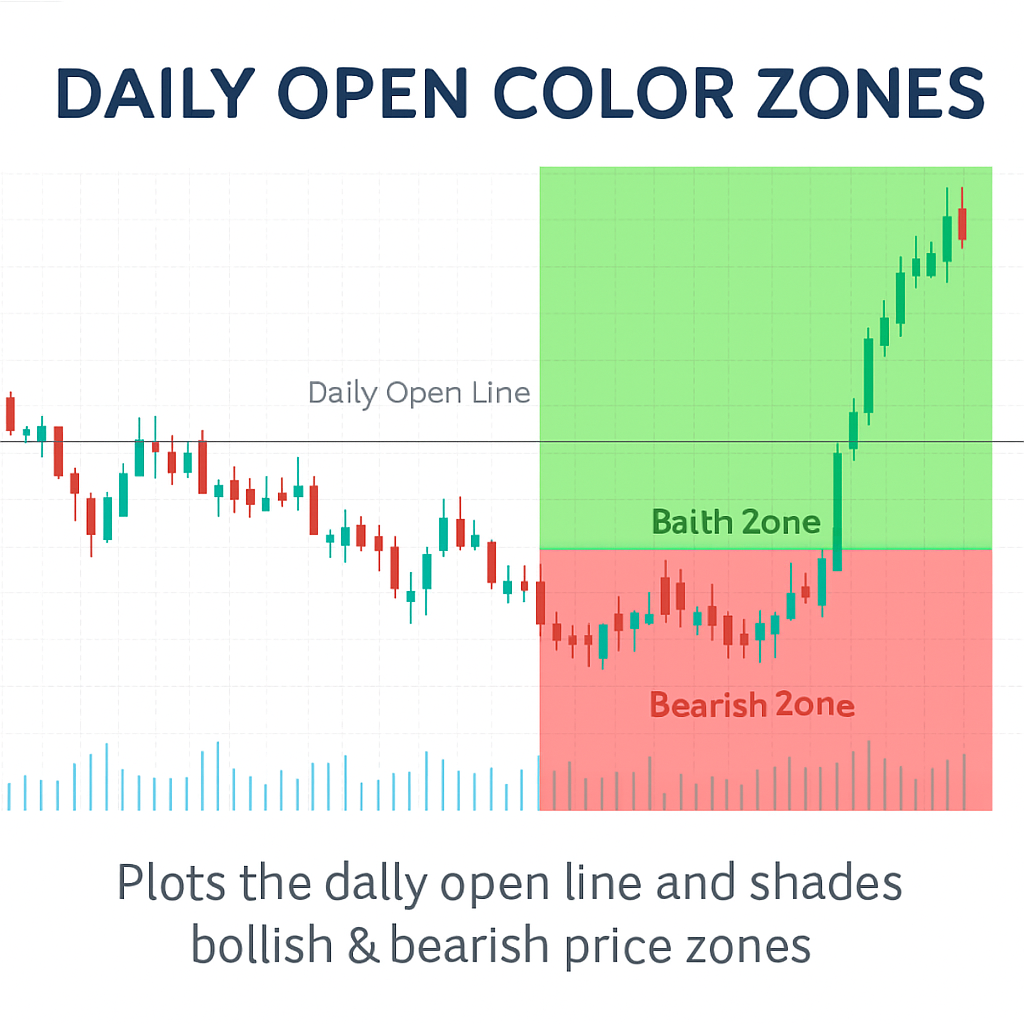
This indicator plots the Daily Open Line and shades the bullish and bearish price zones around it.
It provides a clear visual reference to see whether the market is trading above or below the daily open, which is a commonly used level in intraday analysis.
The indicator automatically draws a horizontal line at the daily open price and highlights the chart areas:
- Green zone above the line (bullish area).
- Red zone below the line (bearish area).
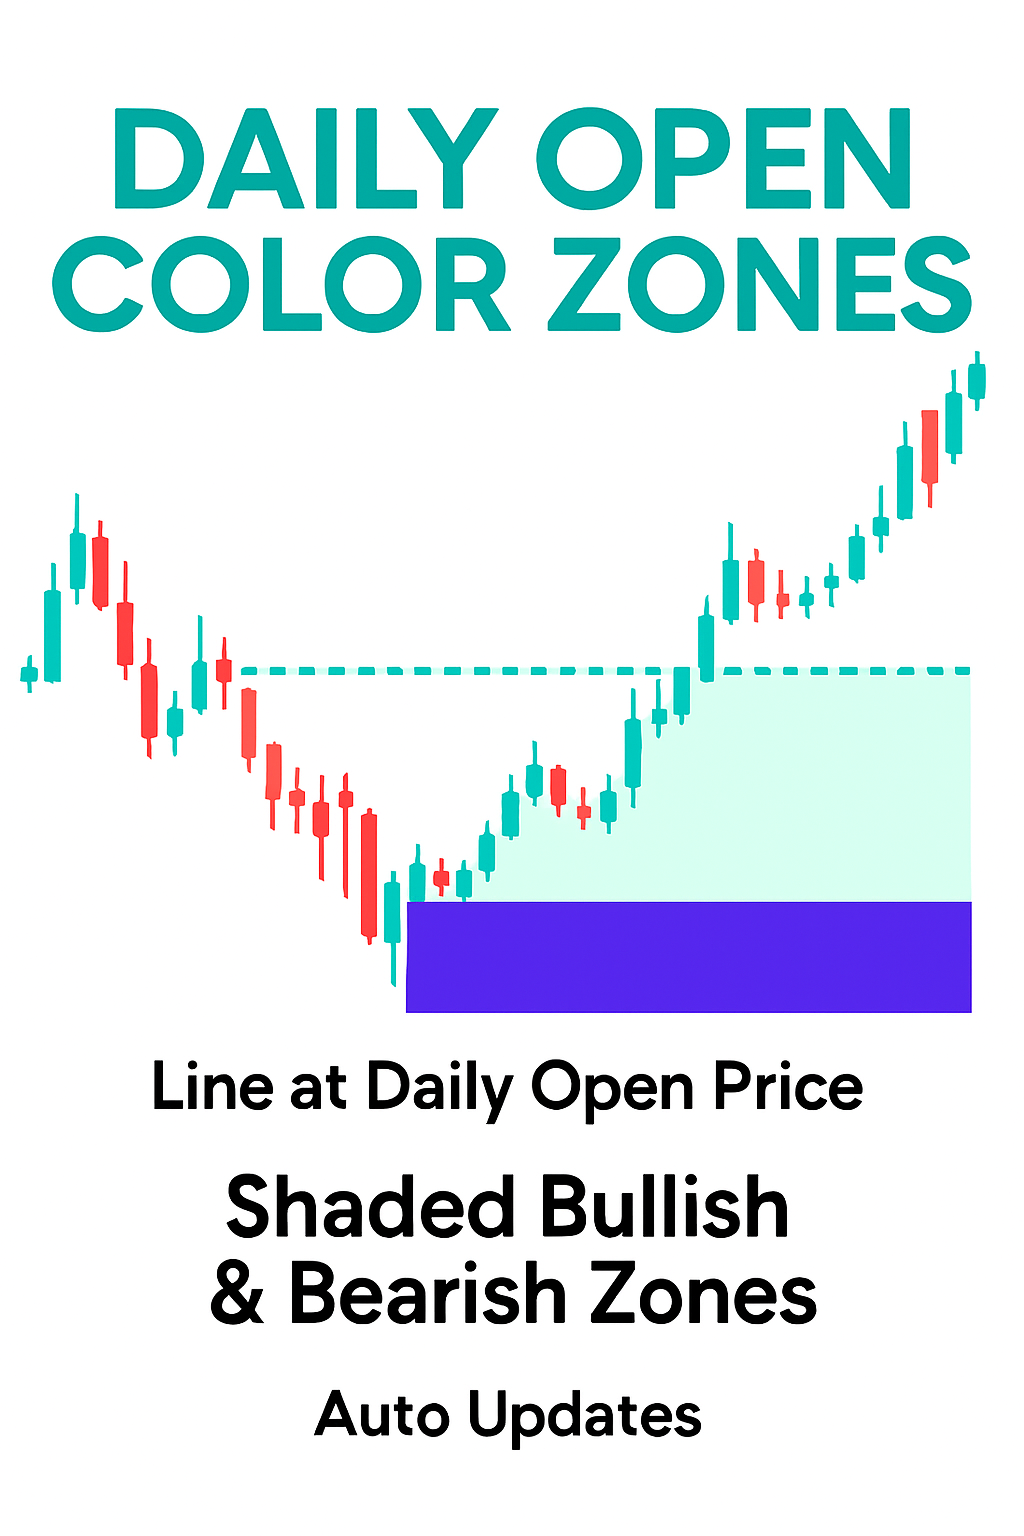
Features:
- Automatic Daily Open Line: precise plotting of the daily open price.
- Color Zones: easily distinguish bullish and bearish areas with customizable colors.
- Dynamic Updates: zones adjust automatically with each new candle.
- Customizable appearance: line style, thickness, and zone colors can be modified.
- Lightweight and efficient: designed for minimal CPU usage.
- Works on all symbols and timeframes.
Conclusion:
The indicator offers a clear chart visualization of the daily open and the related bullish/bearish zones. It can be applied to different markets and timeframes for technical analysis.
More from this author
.png)
.jpg)
.jpg)
.jpg)
 (1).jpg)
.jpg)
.jpg)
.jpg)
.jpg)
.jpg)
.jpg)
You may also like

.jpg)

.jpg)