Indicator
NAS100
NZDUSD
Martingale
Forex
Fibonacci
EURUSD
MACD
BTCUSD
SMC
Indices
ATR
Stocks
Grid
RSI
Breakout
XAUUSD
FVG
Commodities
Signal
Bollinger
GBPUSD
AI
VWAP
ZigZag
Prop
Supertrend
Crypto
USDJPY
Scalping
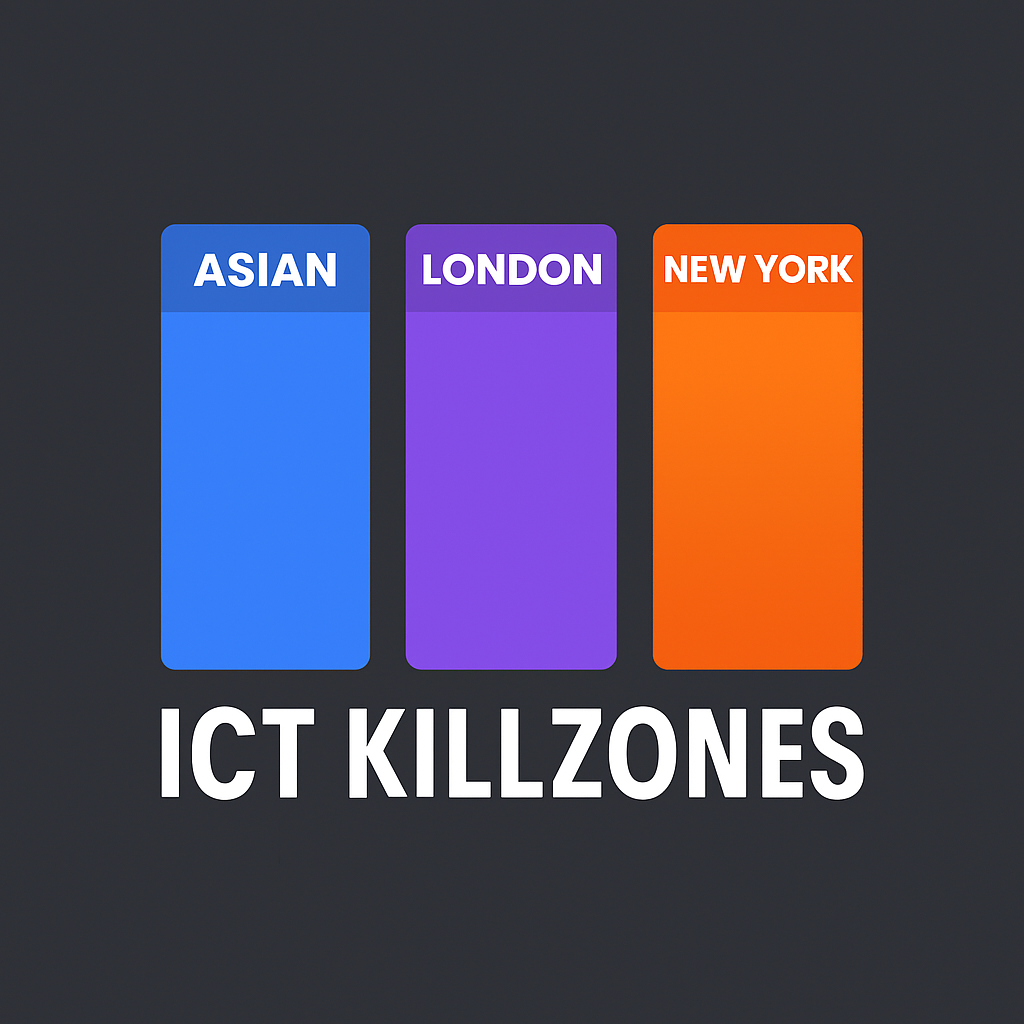
ICT Killzones

01/10/2025
Desktop
Full Description:
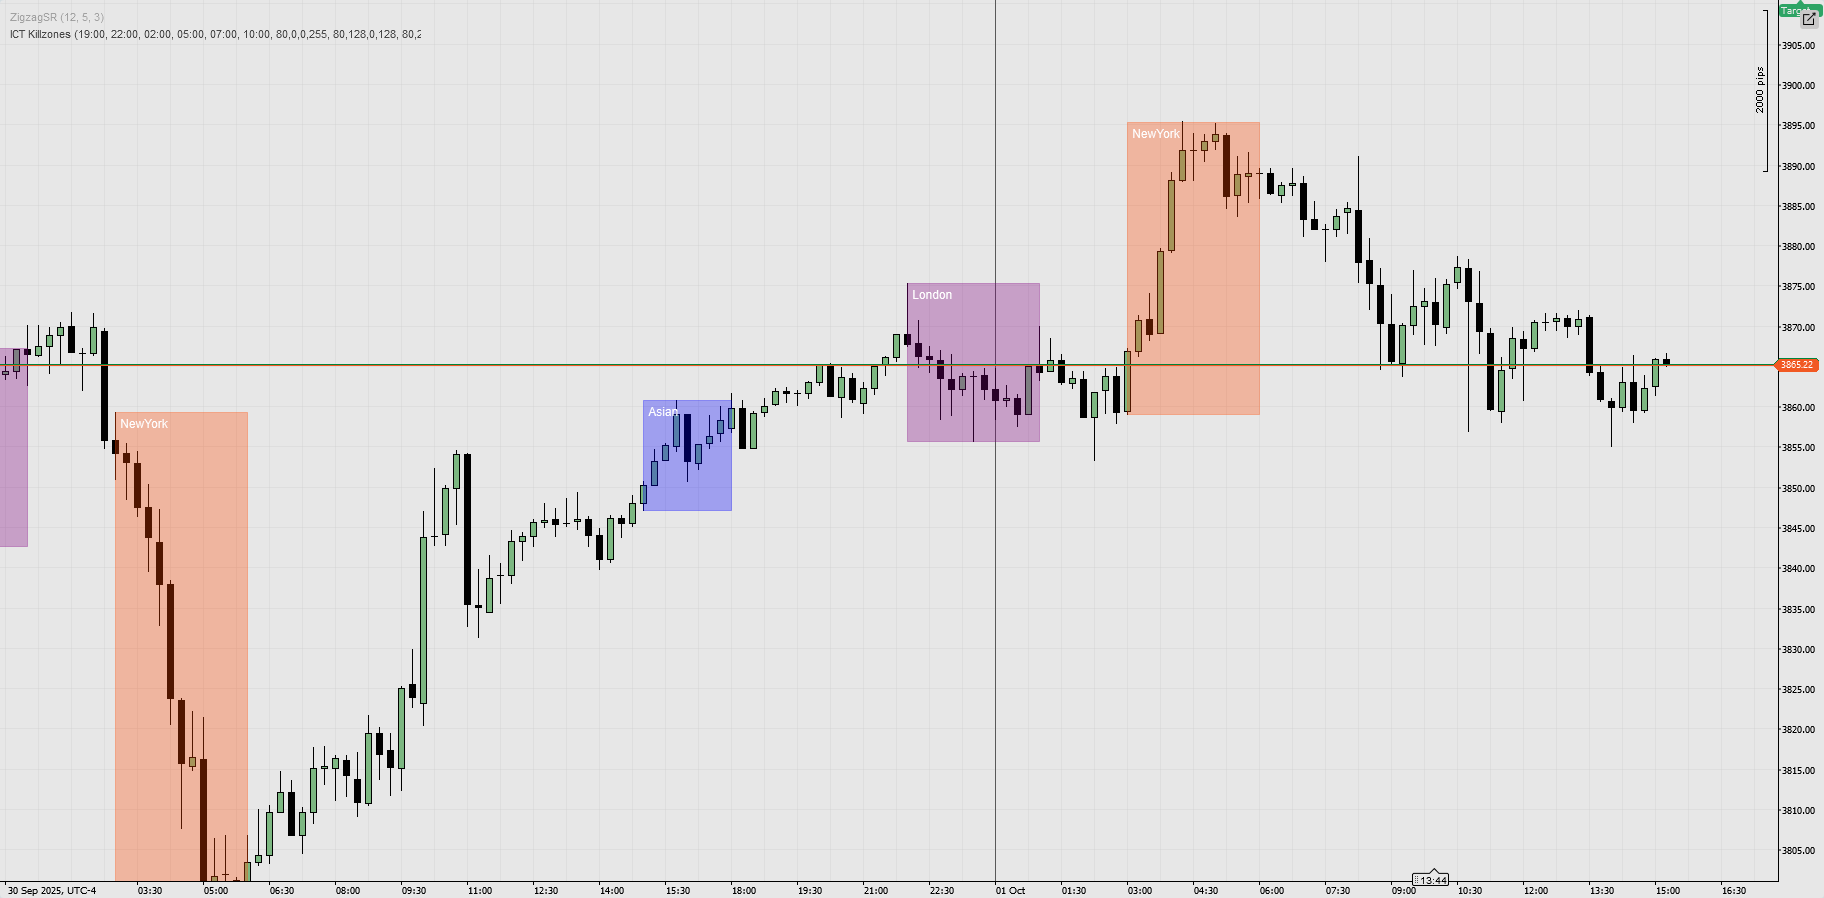
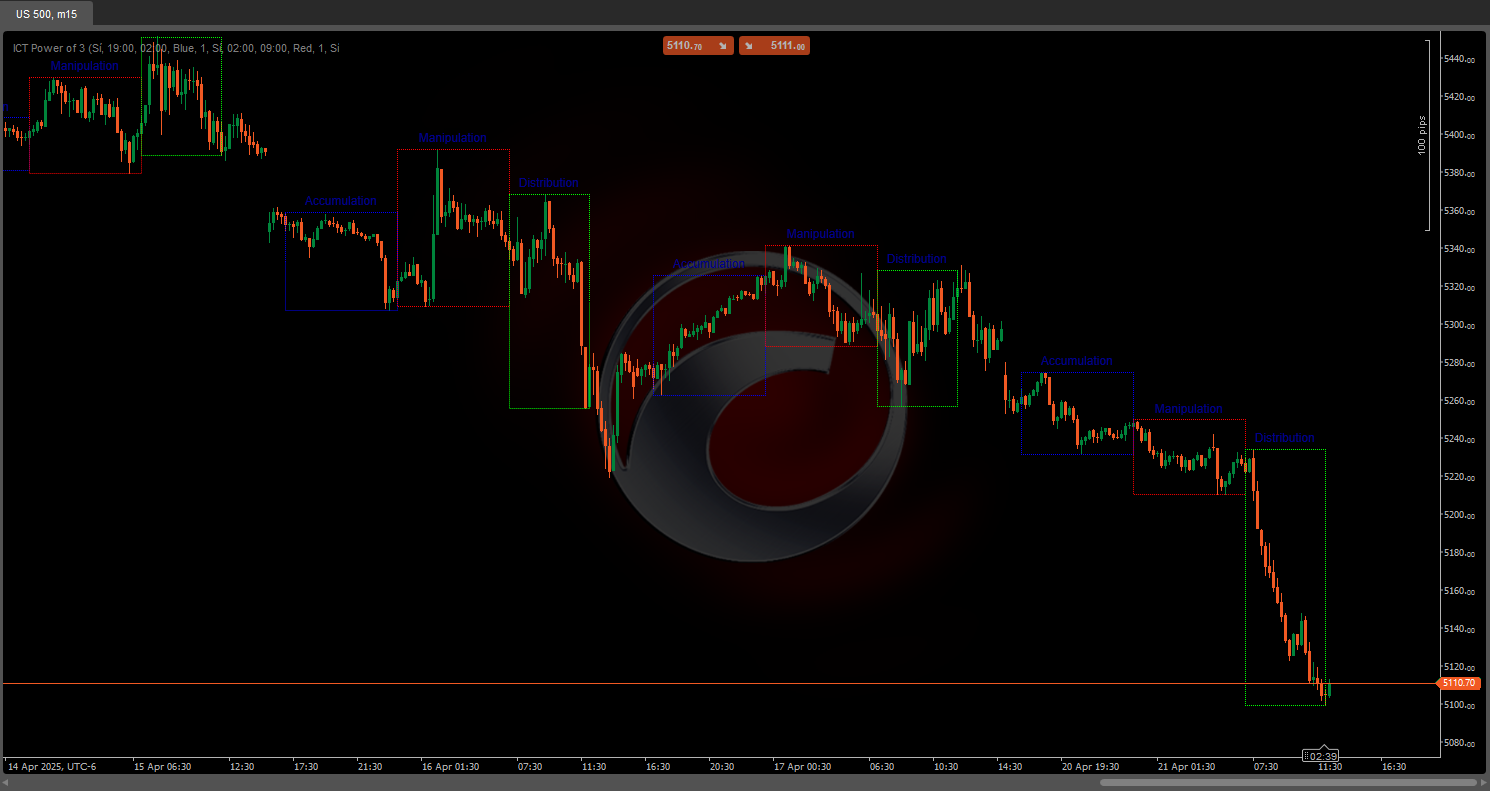
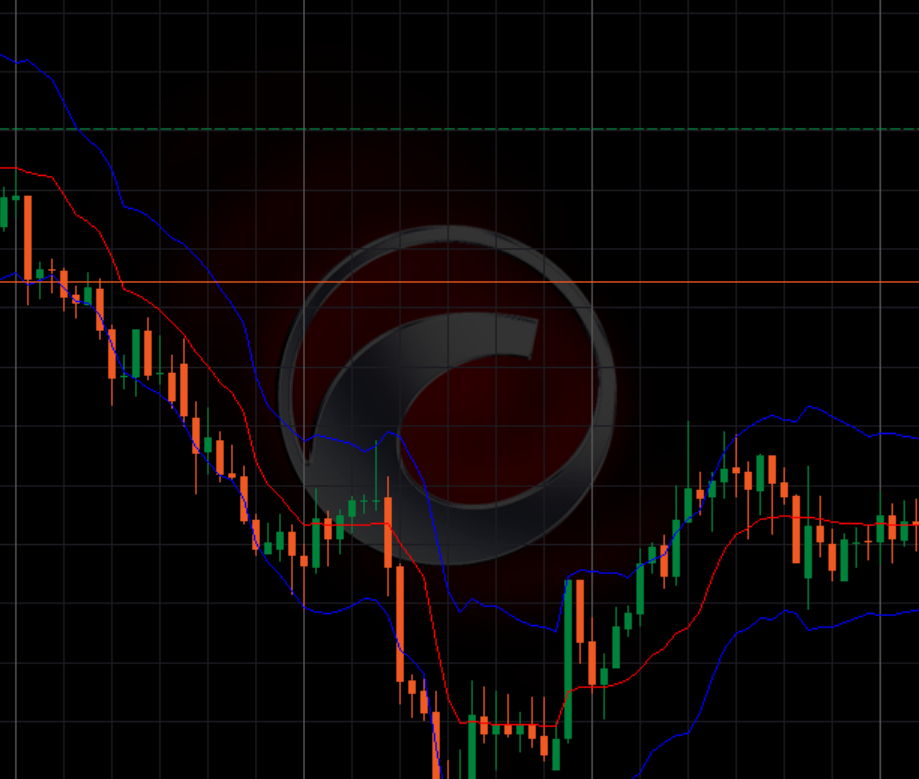
ICT Killzones – Precision Timing for Smart Money Traders
Unlock the power of institutional trading sessions with the ICT Killzones indicator for cTrader. This tool automatically marks the most important market sessions — Asian, London, and New York — directly on your chart, helping you identify high-probability trade setups based on ICT (Inner Circle Trader) concepts.
Key Features:
- Automatic Session Marking: Instantly plots the Asian, London, and New York killzones on your chart.
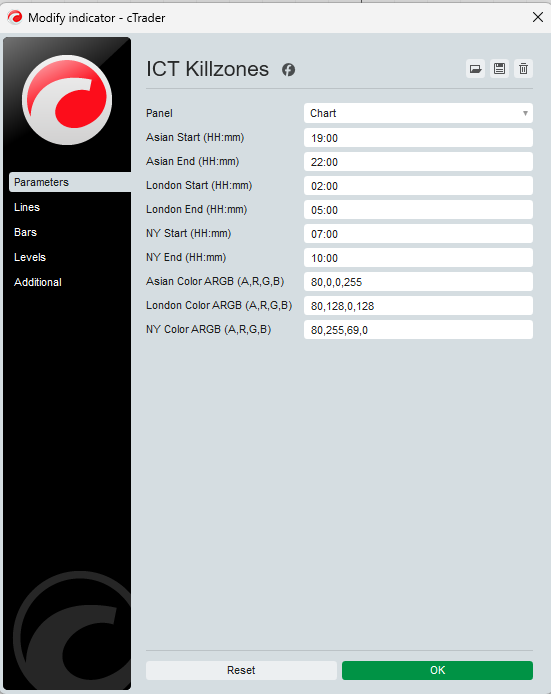
- Customizable Parameters: Adjust session times, colors, and transparency to suit your trading style.
- Session Labels: Clearly labeled zones for quick identification.
- Multi-Timeframe Support: Works seamlessly across all timeframes.
- Optimized Performance: Lightweight design ensures smooth operation without lag.
Ideal For:
- Traders following ICT methodologies.
- Day traders and scalpers seeking precision timing.
- Anyone looking to align trades with institutional activity.
Enhance your trading strategy with ICT Killzones and trade with confidence during key market sessions.
System Requirements:
- Platform: cTrader Desktop (cTrader Store products are not supported on Web or Mobile versions) blog.ctrader.com
- Operating System: Windows 7 or higher
- Processor: Dual-core CPU
- Memory: 2 GB RAM minimum
- Internet Connection: 50 kB per second or faster
Installation Instructions:
- Purchase or Install: Obtain the indicator from the cTrader Store.
- Download cTrader Desktop: If not already installed, download and install cTrader Desktop from here.
- Log In: Open cTrader Desktop and log in using your cTrader ID.
- Access the Indicator: Navigate to the "Algo" section, and your purchased indicator should appear under the "Indicators" list.
- Add to Chart: Right-click on any chart, select "Indicators," and add the ICT Killzones indicator to your chart.
More from this author


.jpeg)


You may also like

.jpeg)


!["[Hamster-Coder] Bollinger Bands" logo](https://market-prod-23f4d22-e289.s3.amazonaws.com/1114cb2b-7120-42b3-8f53-dbc26968e6af_Icon300.jpg)