Indicator
Indices
Prop
Breakout
Commodities
Stocks
Forex
Crypto
Higher TimeFrame Candle Tracker
"Higher TimeFrame Candle Tracker" logo
10/10/2025
Desktop
Since 30/09/2024
Sales
34
"Higher TimeFrame Candle Tracker" uploaded image"Higher TimeFrame Candle Tracker" uploaded image"Higher TimeFrame Candle Tracker" uploaded image"Higher TimeFrame Candle Tracker" uploaded image"Higher TimeFrame Candle Tracker" uploaded image

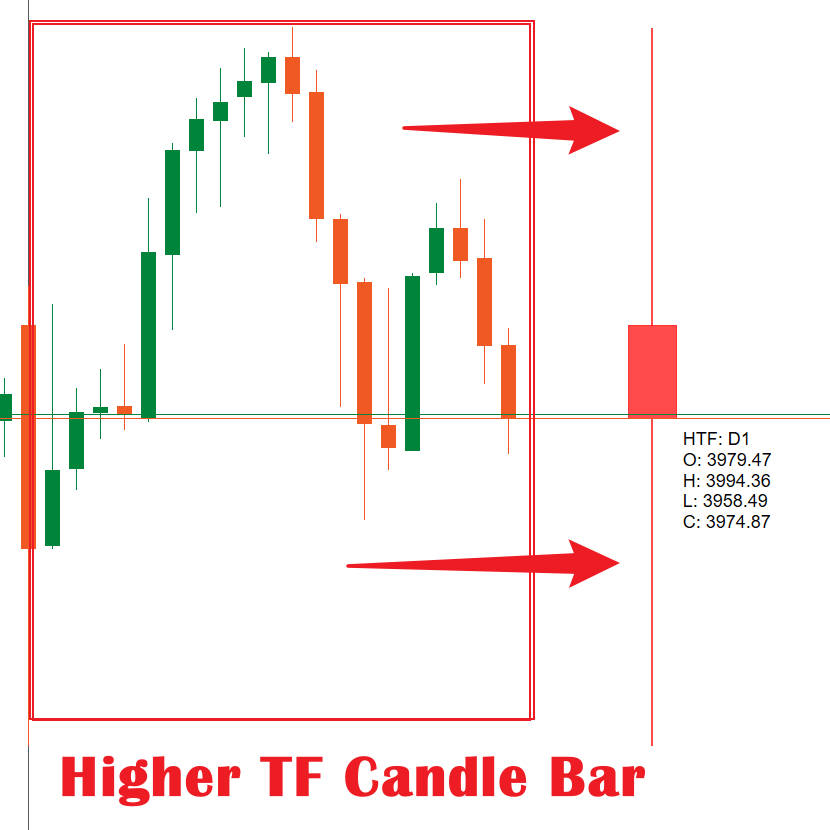
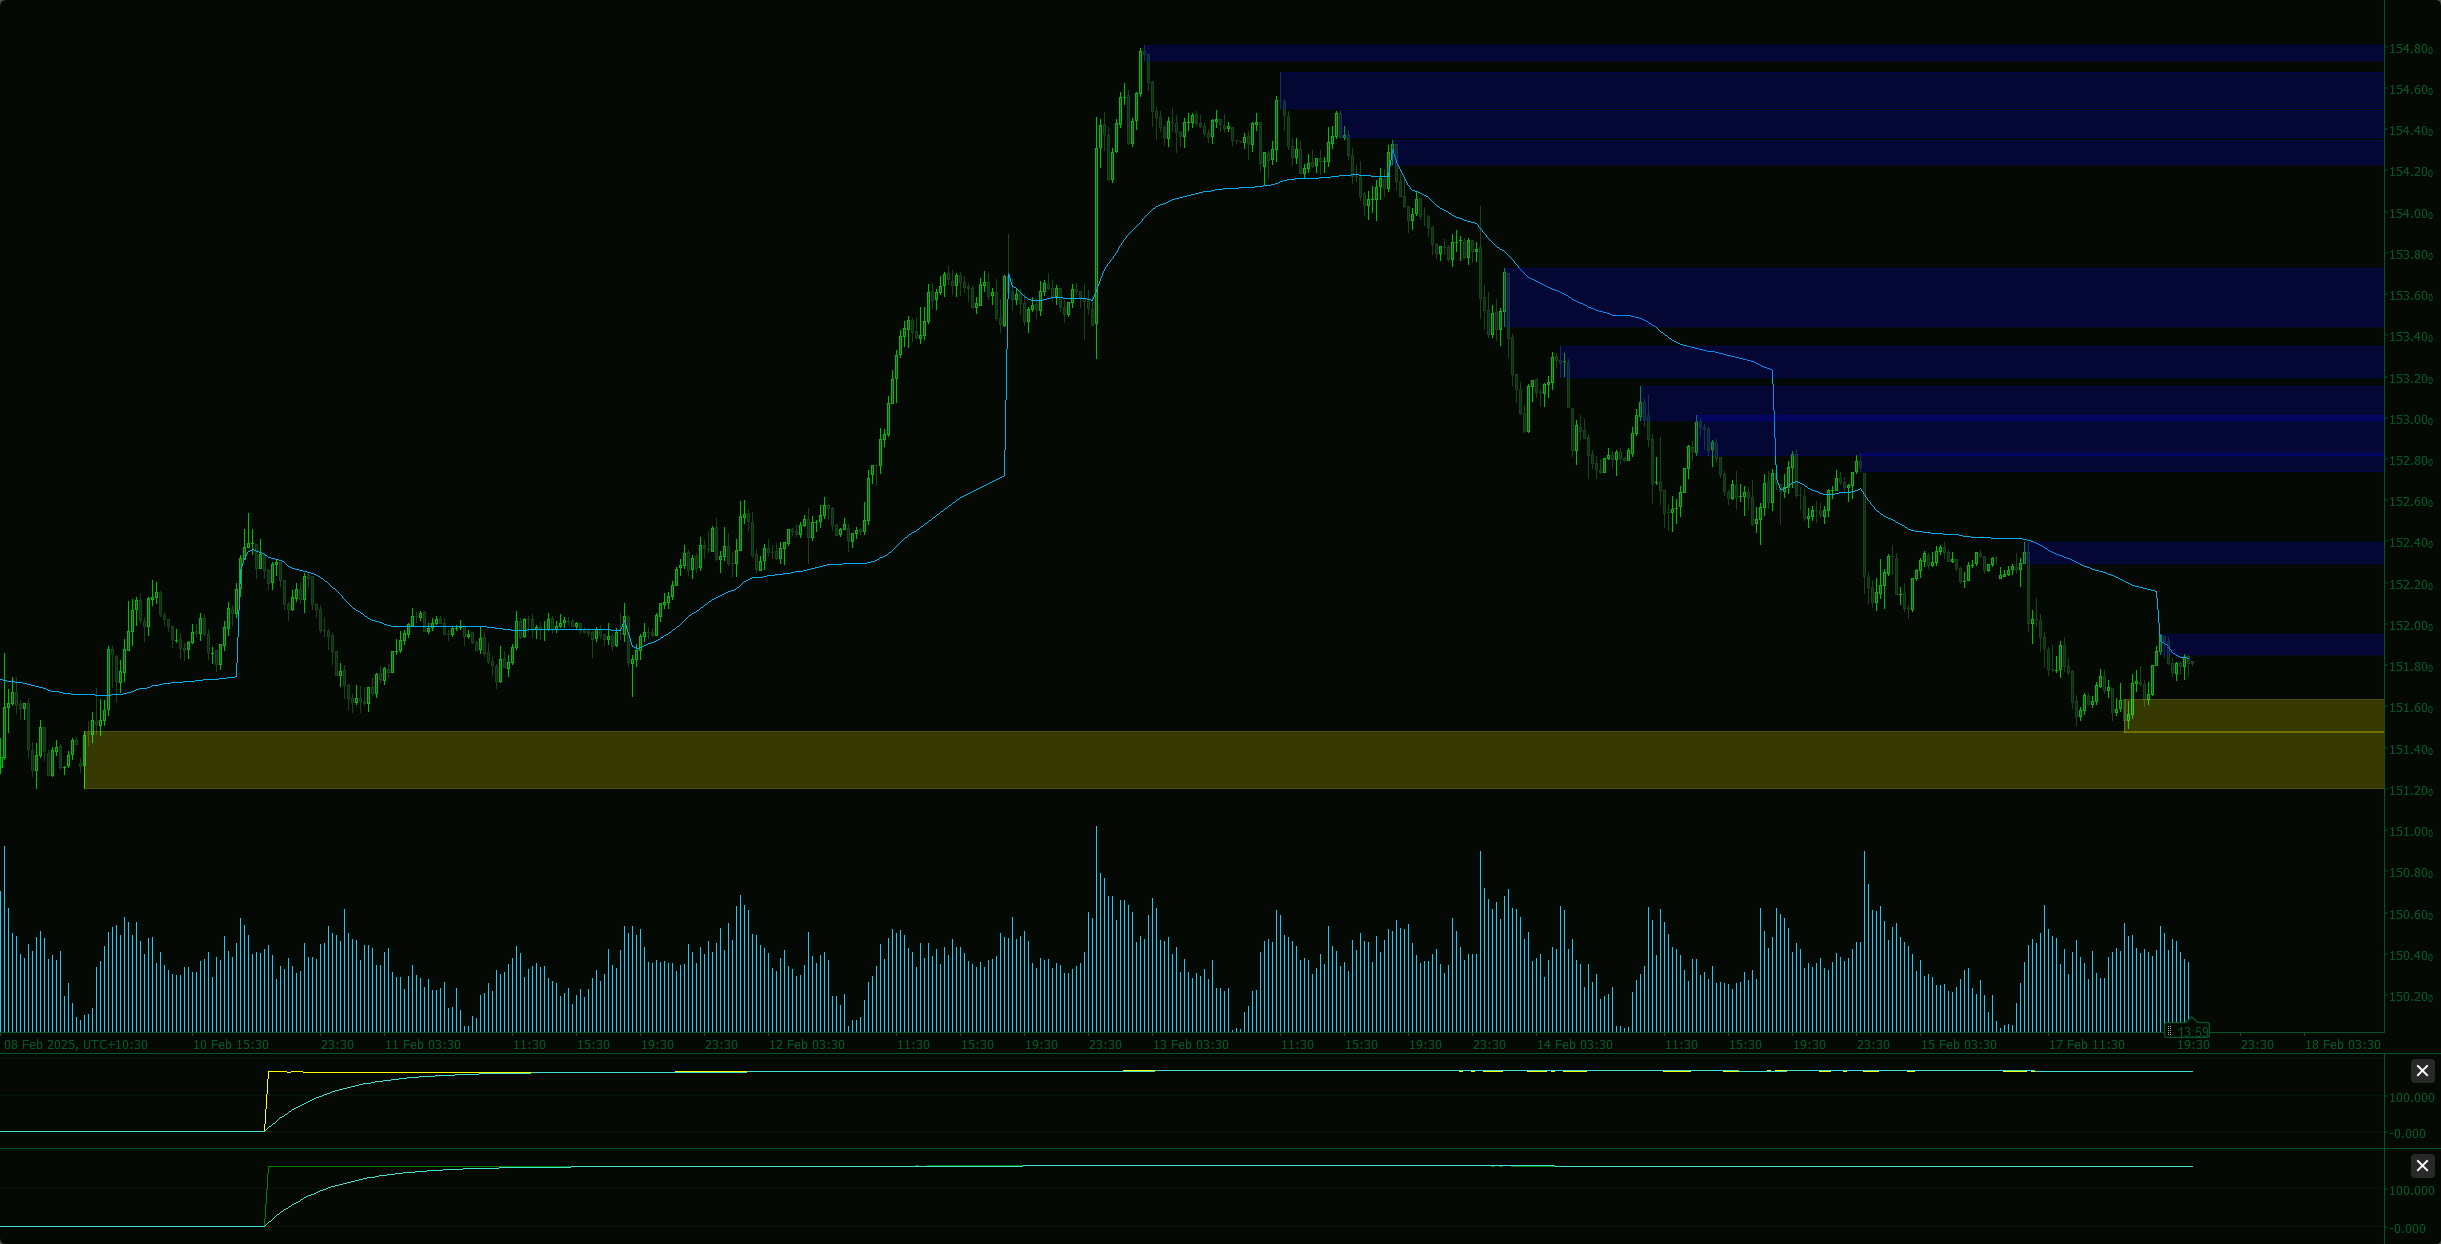
The Higher timeframe candle tracker is used to get a glimpse of what the selected higher time frame candle is like.

Key Features:

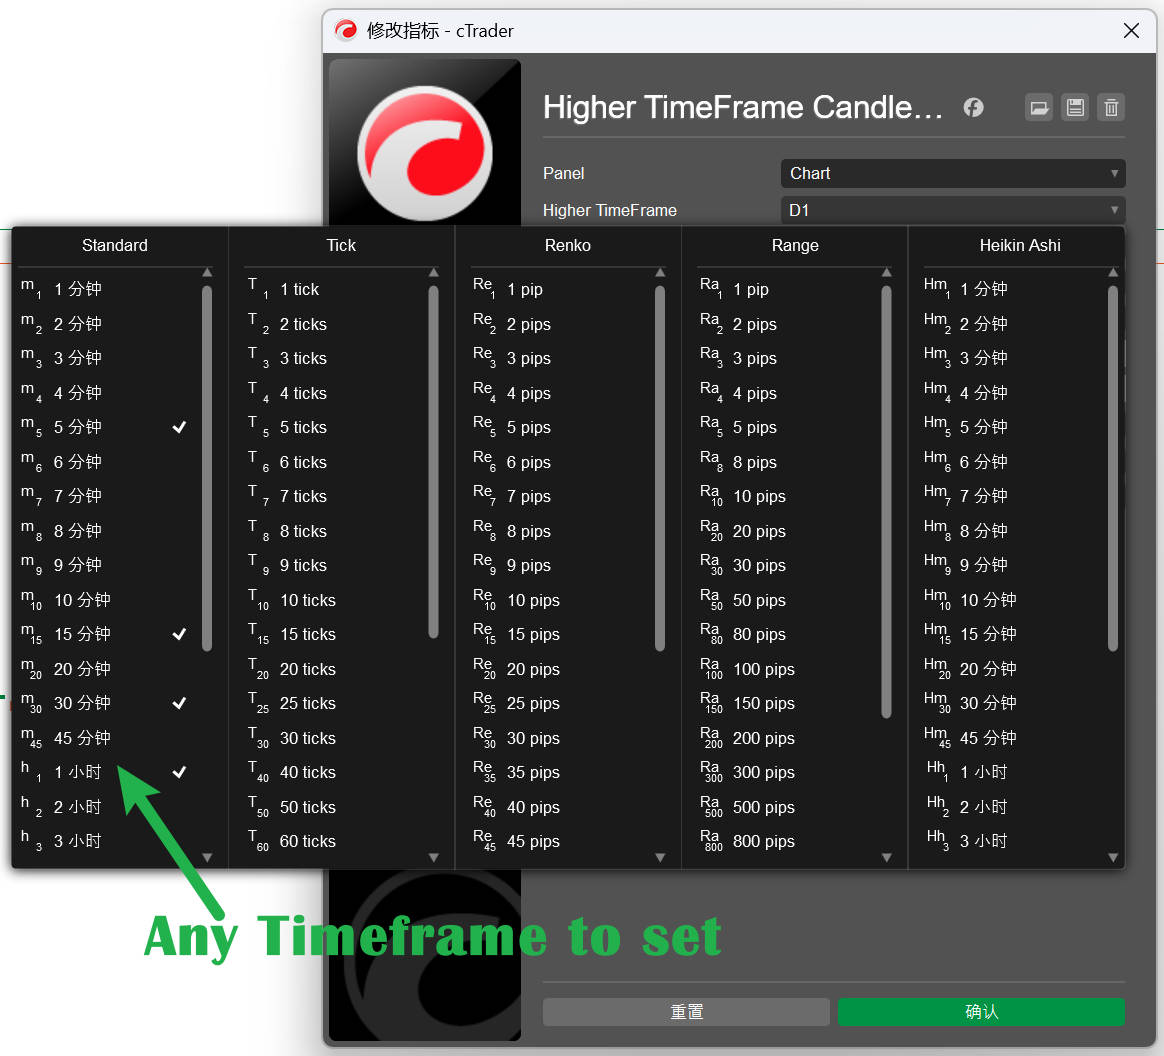
  1. Customizable Timeframe Selection - Choose any higher timeframe (Daily, Weekly, Monthly, etc.)
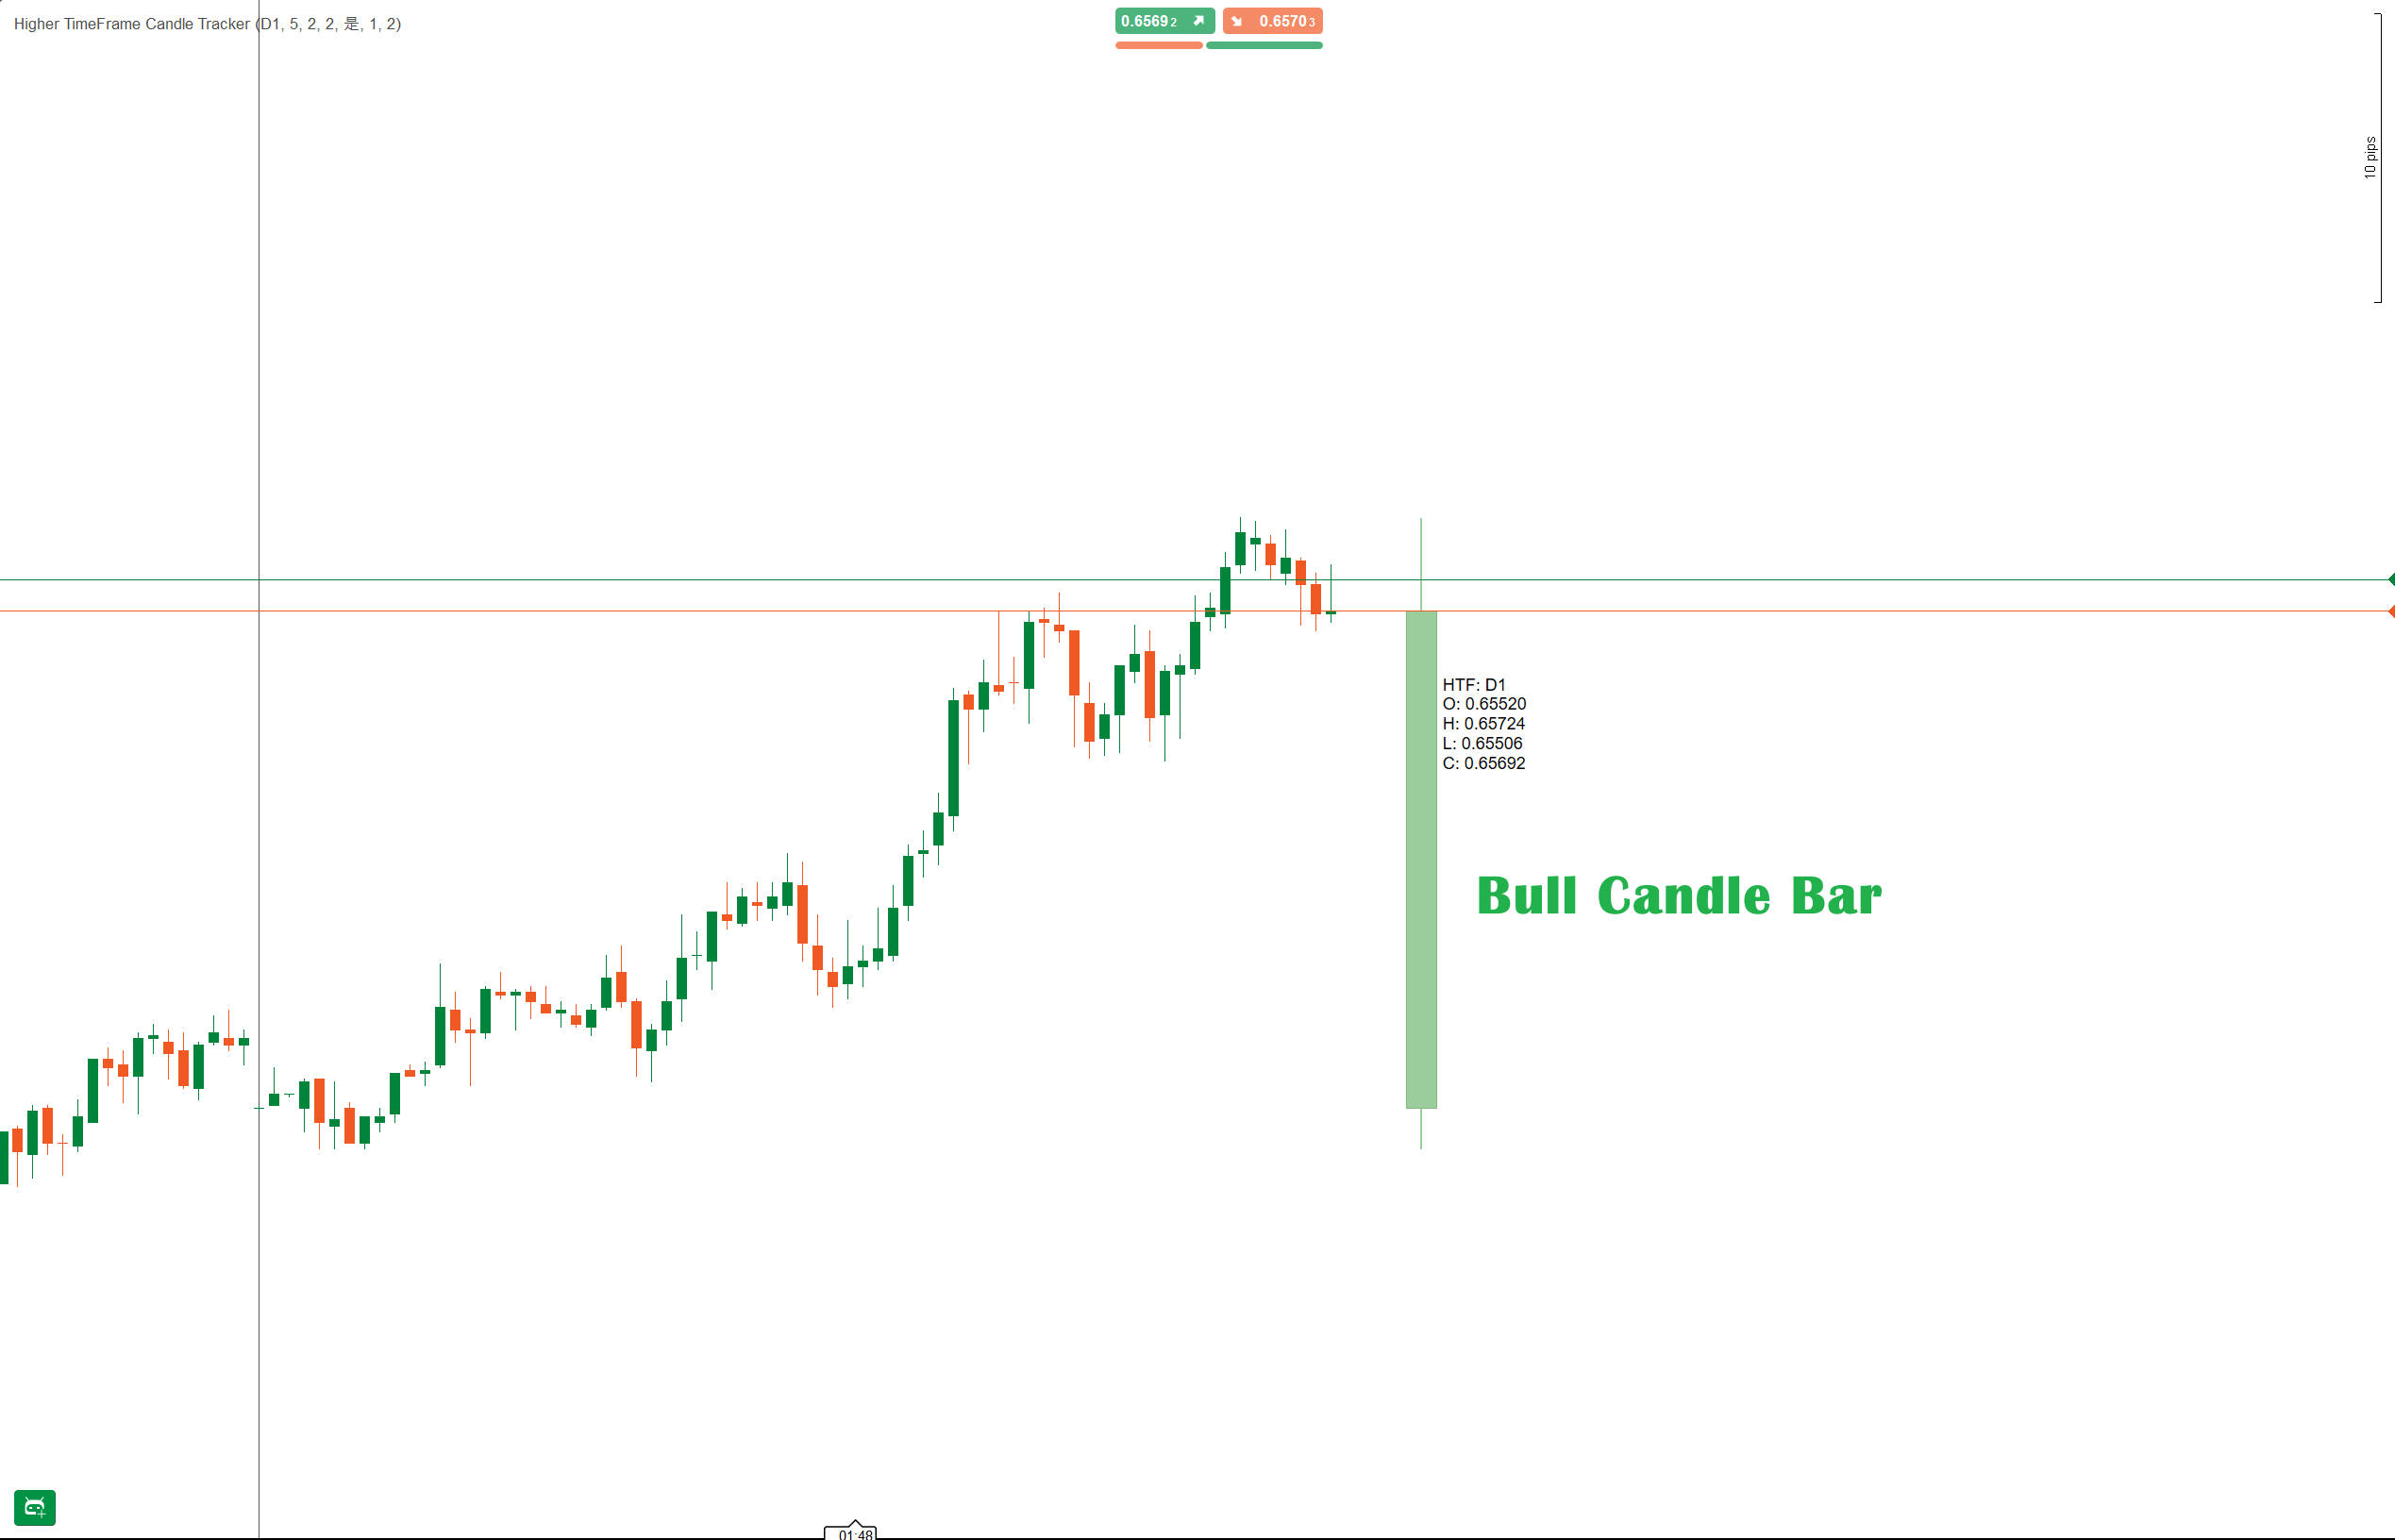
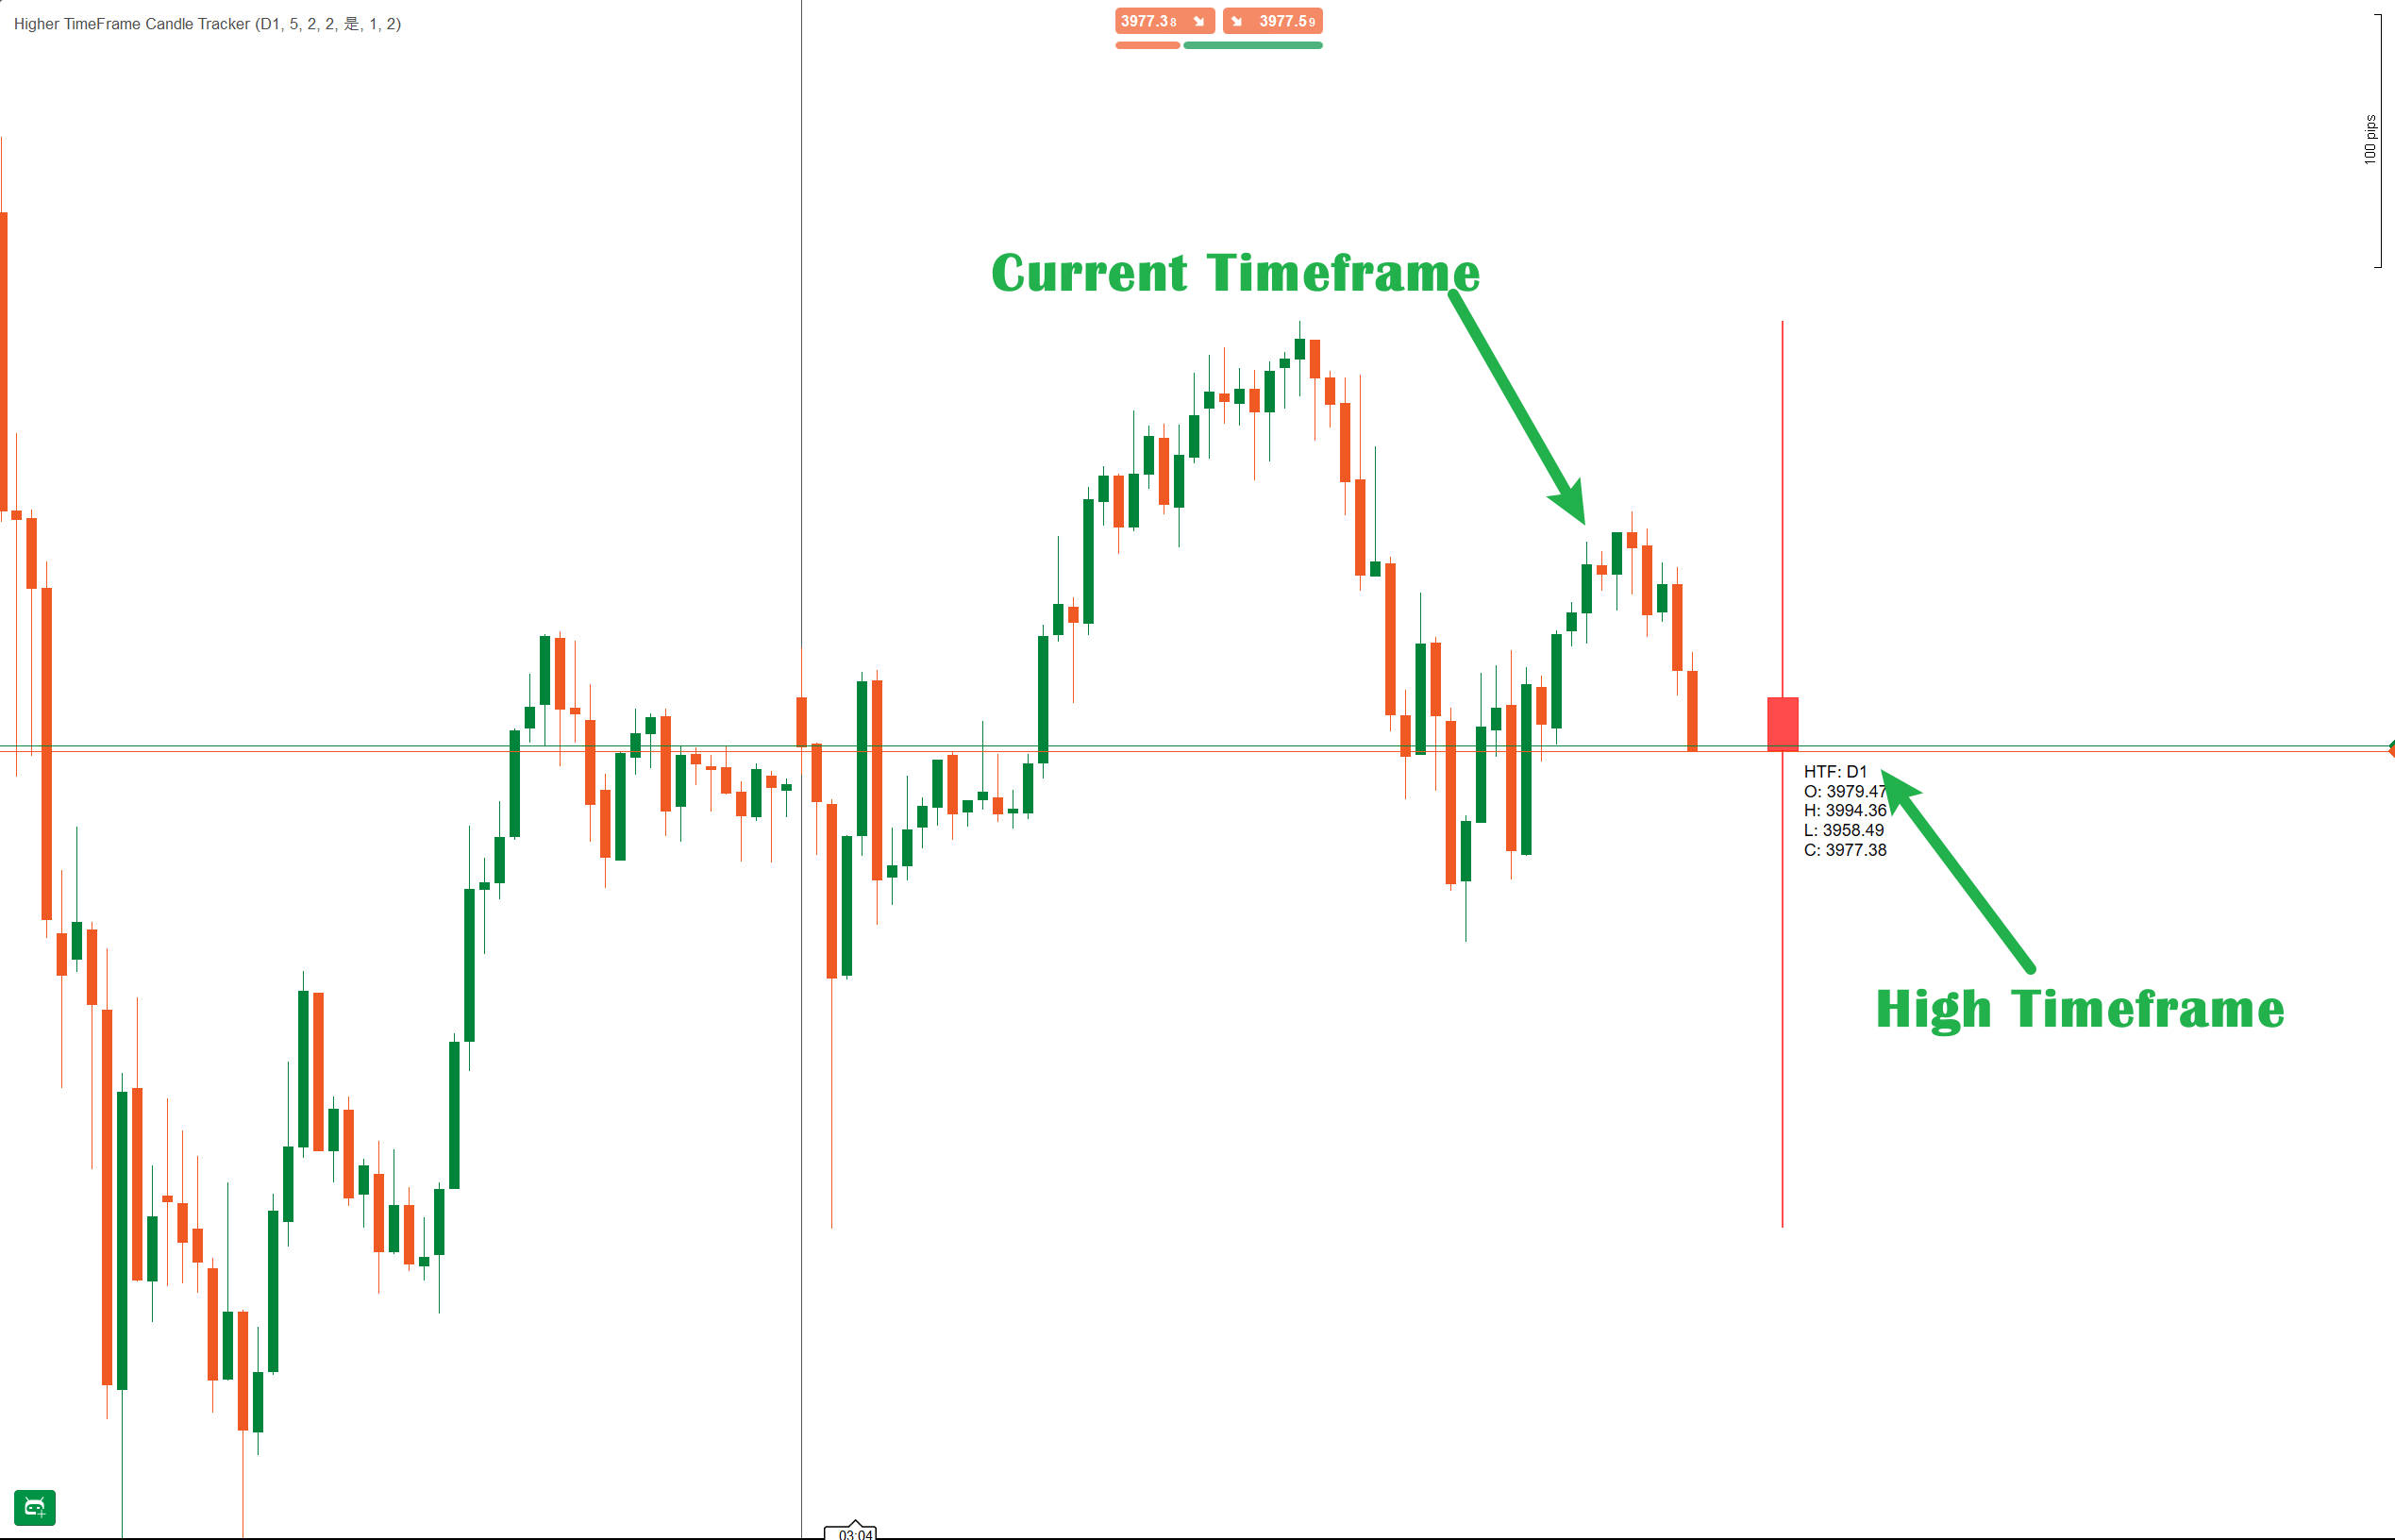
  2. Visual Candle Display - The current HTF candle is plotted with proper wicks and body, offset from the current price action

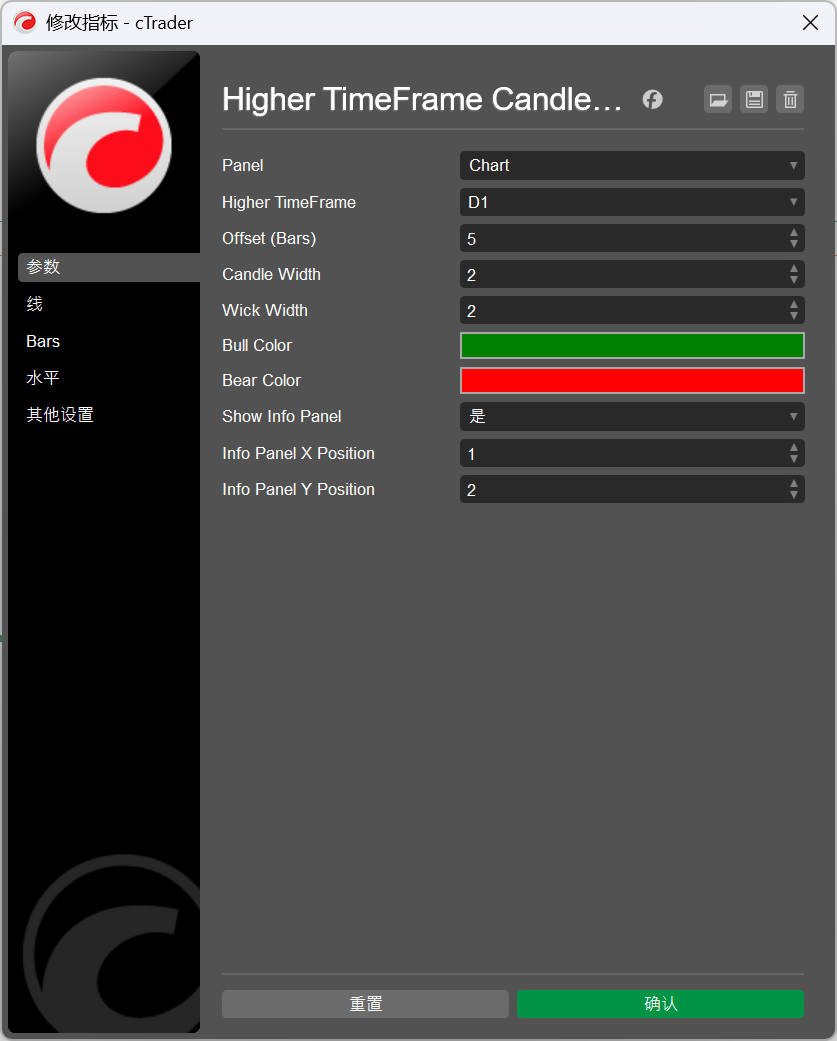
Adjustable Settings:

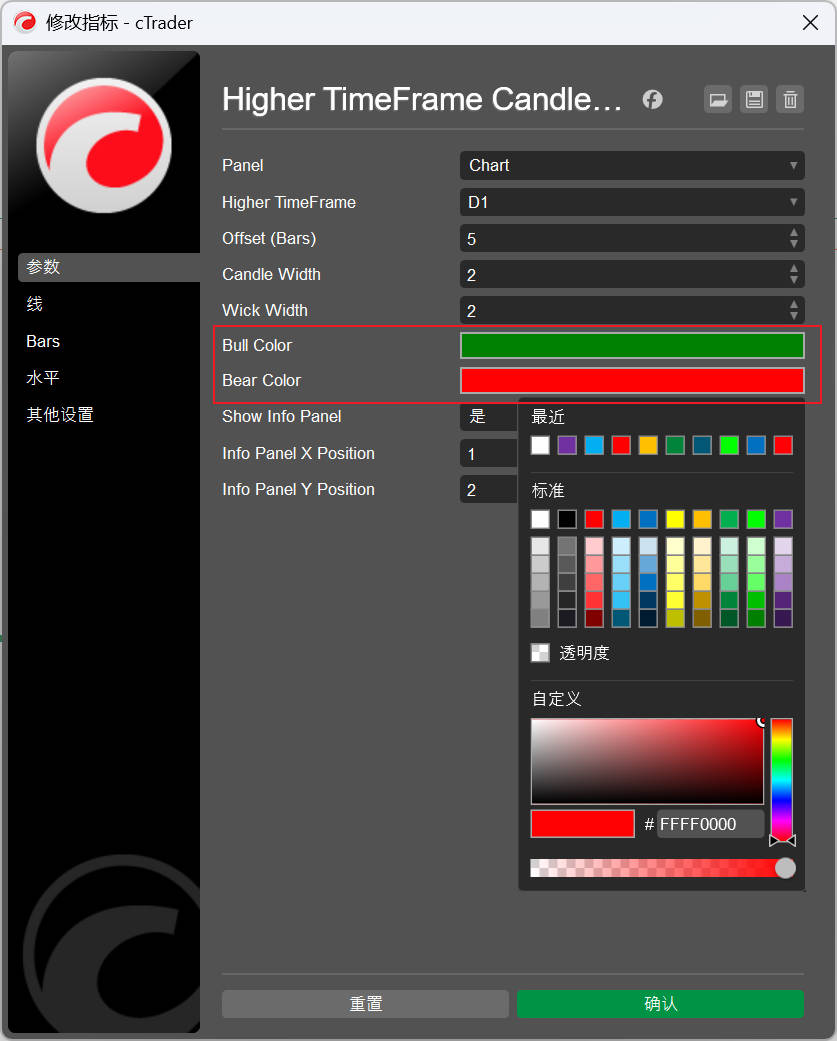
  1. Offset: Distance in bars from current price (default: 5)
  2. Candle Width: Thickness of the candle body (1-10, default: 3)
  3. Wick Width: Thickness of the wick lines (1-5, default: 1)
  4. Colors: Customizable bull (green) and bear (red) colors

Support TimeFrame:

  • Minute, Minute2, Minute3, Minute4, Minute5
  • Minute10, Minute15, Minute30, Minute45
  • Hour, Hour4, Hour12
  • Daily, Day2, Day3
  • Weekly, Monthly

Information Table - Displays real-time HTF candle data: Open, High, Low, Close values.


中文说明:

可自定义参数:

  • Higher TimeFrame(高时间框架) - 选择要跟踪的时间框架(默认:Daily)
  • Offset(偏移量) - K线距离当前价格的位置(默认:5根K线)
  • Candle Width(K线宽度) - K线实体的宽度(1-10,默认:3)
  • Wick Width(影线宽度) - 影线的宽度(1-5,默认:2)
  • Bull Color(看涨颜色) - 看涨K线颜色(默认:Green)
  • Bear Color(看跌颜色) - 看跌K线颜色(默认:Red)
  • Show Info Panel(显示信息面板) - 是否显示HTF数据面板(默认:true)

核心特性:

  1. 实时HTF K线显示 - 在图表上绘制当前高时间框架K线
  2. 完整的K线结构 - 包含实体、上影线和下影线
  3. 颜色区分 - 自动根据涨跌使用不同颜色
  4. 信息面板 - 显示Open、High、Low、Close和方向指示
  5. 自适应填充 - 看涨K线半透明,看跌K线较深


支持的时间框架:

  • Minute, Minute2, Minute3, Minute4, Minute5
  • Minute10, Minute15, Minute30, Minute45
  • Hour, Hour4, Hour12
  • Daily, Day2, Day3
  • Weekly, Monthly
0.0
Reviews: 0
Customer reviews
No reviews for this product yet. Already tried it? Be the first to tell others!
More from this author
Indicator
Breakout
Pivot Points Daily Session
Pivot Point with base zone daily Asia-London-New york Session.
Volume Weighted Average Price
VWAP is a powerful tool for intraday traders
IRiskRewardTools
Risk Reward Management Tools(风险回报管理工具)
Indicator
RSI
Breakout
MACD
ZigZagColor
The ZigZag indicator is a technical analysis tool primarily used to identify key price reversal points.
SuperEmaColorRSI
This is a super indicator that integrates the RSI indicator with a dual moving average system.
Indicator
Indices
Breakout
Commodities
+3
Daily Levels
The "Daily Levels" indicator is used to display last week's and yestoday high/low price
You may also like
E7 Volume Profile
E7 Volume Profile, more modern look and feel.
Indicator
Breakout
Fx4U.Multi TimeFrame Support & Resistance
Allow trader to visualize Support & Resistance across different timeframes,give trader an overview of the current market
Indicator
NAS100
NZDUSD
XAUUSD
+10
Moving Average PRO
Customize your Moving Average! Choose any timeframe and price source for precision and flexibility in your analysis.
MMXM Structure by Ludwig
MMXM Structure by LudwigICT – Professional Market Structure Mapping Tool
Indicator
Indices
Prop
Stocks
+3
Fractals
Fractals is a precision-engineered trading indicator for cTrader that reveals the hidden architecture of price action.
Indicator
Indices
Commodities
Stocks
+2
XY Bar Info Panel v1.5
Overlay panel showing bar date/time, OHLC, tick Volume, percent change, and market session - fully customizable.
KAMA
Custom KAMA Indicator – Optimized for Speed and Precision
Indicator
NAS100
NZDUSD
XAUUSD
+13
Chandelier Exit
Optimize exits with Chandelier Exit! Visualize stop-loss points dynamically for improved trading precision and safety.
E7 Polynomial Regression Channel
Polynomial Regression Channel which also reflects the volatility of the underlying asset.
Indicator
Indices
Breakout
XAUUSD
+8
Phoenix Zones
Phoenix Zones - Detector de Reversiones Críticas
Pivot Points Clasic,FIBO,etc
All-in-one Pivot Indicator: set Classic, Fibo, Woodie, Camarilla, Demark methods, style levels & labels your way ;)
Supply Demand - BasicV1
Supply and demand zones. They're important. Here's a free version to get you started!
Indicator
Indices
RSI
StochasticRSI
Stochastic RSI (StochRSI) is a technical indicator used to measure the strength and weakness of the RSI.
Indicator
RSI
Breakout
XAUUSD
+12
Liquidity Pressure Index
Liquidity Pressure Index is a tool that gives traders deeper insights into the hidden dynamics of market liquidity
Indicator
NAS100
NZDUSD
XAUUSD
+10
Relative Moving Average
Bring the RMA to cTrader! This is the Relative Moving Average from TradingView.
ZigZagSmartAlert_demo
ZigZag Smart Alert DEMO for cTrader DEMO VERSION 24 hours free trial! This is a DEMO version of the ZigZag Smart Aler
Fibonacci Prediction Channel
Designed to plot a future prediction channel based on Fibonacci retracement levels 📊
Indicator
Indices
RSI
Signal
Rsi + Volume
This indicator combines RSI (Relative Strength Index) with volume analysis to generate more reliable trading signals.