"Relative Moving Average" logo
Relative Moving Average
"Relative Moving Average" uploaded image
Since 25/09/2025
21
Sales
191
Free installs

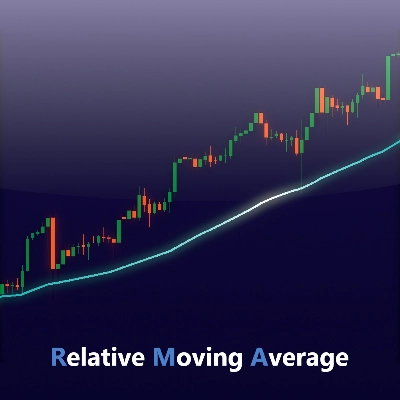
Introducing the Relative Moving Average (RMA) indicator, now available for cTrader!

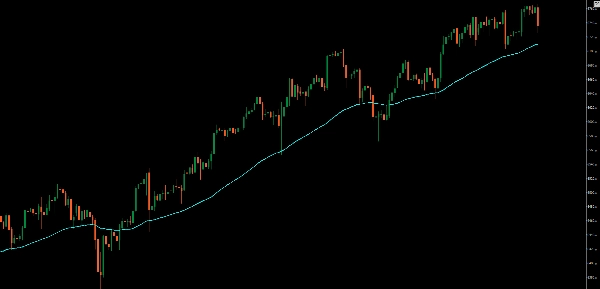
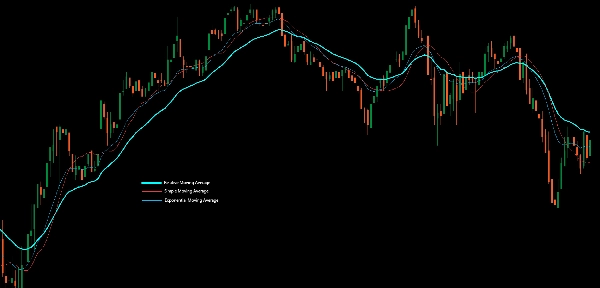
The Relative Moving Average (RMA) — also known as the Smoothed Moving Average (SMMA) — is a type of moving average that aims to reduce lag while maintaining smoothness in the curve. It’s the same formula used by TradingView’s built-in “RMA” function, which is widely used in popular indicators like the Relative Strength Index (RSI).

The RMA is designed to balance between responsiveness and stability. It updates more smoothly than an Exponential Moving Average (EMA) but reacts more quickly to price changes than a Simple Moving Average (SMA).
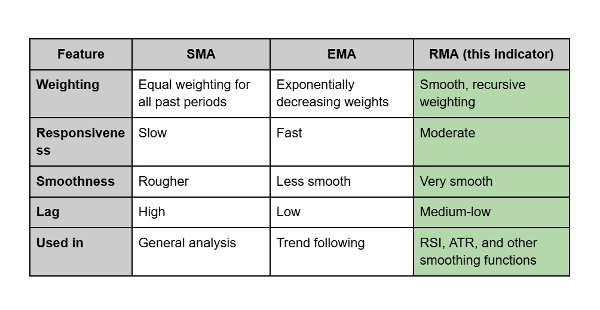
How It Differs:

  • The SMA averages all prices equally, causing lag and choppiness.
  • The EMA gives more weight to recent prices, making it very responsive but sometimes noisy.
  • The RMA, in contrast, blends the benefits of both: it smooths out volatility while maintaining timely reactions to price shifts.


Practical Use:

Traders often use the RMA as a smoother trend line or as part of momentum indicators. It’s particularly effective when you want to filter noise without introducing significant lag — ideal for confirming longer-term trends or supporting overbought/oversold analyses.

Indicator profile
0.0
Reviews: 0
Customer reviews
No reviews for this product yet. Already tried it? Be the first to tell others!
BTCUSD
Forex
Indices
EURUSD
Commodities
GBPUSD
NZDUSD
Prop
Crypto
Stocks
XAUUSD
NAS100
USDJPY
Products available through cTrader Store, including trading bots, indicators and plugins, are provided by third-party developers and made available for informational and technical access purposes only. cTrader Store is not a broker and does not provide investment advice, personal recommendations or any guarantee of future performance.

More from this author

Professional execution engine for the Visual Risk Terminal. Instant batch orders, PnL syncing, and automated hedging.
1
Profit factor
0%
Max drawdown
Optimize exits with Chandelier Exit! Visualize stop-loss points dynamically for improved trading precision and safety.
Enhance trading with ATR Bands! Visualize market volatility using dynamic upper and lower ATR bands for precise decision
Enhance MACD Histogram! Visualize bull and bear price changes with vibrant colors for clearer, more insightful trading.
Unlock trading precision with QQE! Dual QQE indicators with a Bollinger Bands zero line provide clear buy/sell signals.
Customize the MACD! Choose colors, get real-time tick updates, and see crossover points for enhanced trading precision.
Identify and trade breakouts with Consolidation Zones! Visualize price consolidation areas for trading opportunities.
Unlock Stochastic RSI PRO in cTrader! Overlay RSI, highlight zones, and identify divergences with customizable settings.
Visual risk management terminal for cTrader. Set Lot size, SL, and TP via chart lines with real-time PnL projections.
Customize your Moving Average! Choose any timeframe and price source for precision and flexibility in your analysis.
Visualize trends with Standard Deviation Channel! Display median, and add customizable upper/lower deviation channels.
Advanced MACD & Supertrend bot. Professional trend-following logic with ATR risk management and active profit-taking.
18%
1.82
Profit factor
20.05%
Max drawdown

You may also like

The Woodie CCI Indicator (Woodie Commodity Channel Index) is a variation of the classic CCI indicator
technical analysis tool designed to provide traders with a structured view of market momentum and volatility
Buy at green arrow if trend is bullish and viceversa
Trade fearlessly: auto-adjusts order blocks, manages risks, and ensures precision.
Hybrid adaptive trend filter with clean Buy/Sell signals, dynamic bands and zero-repaint analysis.
💹 Define a price channel 📈 and determine trend direction (bullish 🟢 or bearish 🔴).
The Break of Structure (BoSCHoCh) Indicator is a smart market structure tool designed to help traders easily spot trend.
QQEX Trinity Indicator - The Ultimate Trading Filter
Show Renko Wicks / Tails. Solid Performance!
Laguerre RSI: smoother, faster RSI with less noise. Great for spotting reversals and timing entries.
Customizable corner watermark — display symbol, timeframe, broker, or a live candle countdown without cluttering chart
INSTITUTIONAL VWAP
Multi-timeframe ATR, smart swap calculator, range analysis all in one professional panel.
Z-Score measures price deviation from its average, helping identify extremes, trends, and trading opportunities ........
Volume Squeeze, real-time buying and selling.
Session Volume Profile
Trend Scope Pro – Smarter Trend Analysis with Linear Regression Channels
Since 25/09/2025
21
Sales
191
Free installs