Indicator
XAUUSD
Commodities
FVG_tidypips
"FVG_tidypips" logo
03/09/2025
13
Desktop
SinceĀ 19/11/2024
Sales
15
Free installs
2442
"FVG_tidypips" uploaded image"FVG_tidypips" uploaded image"FVG_tidypips" uploaded image

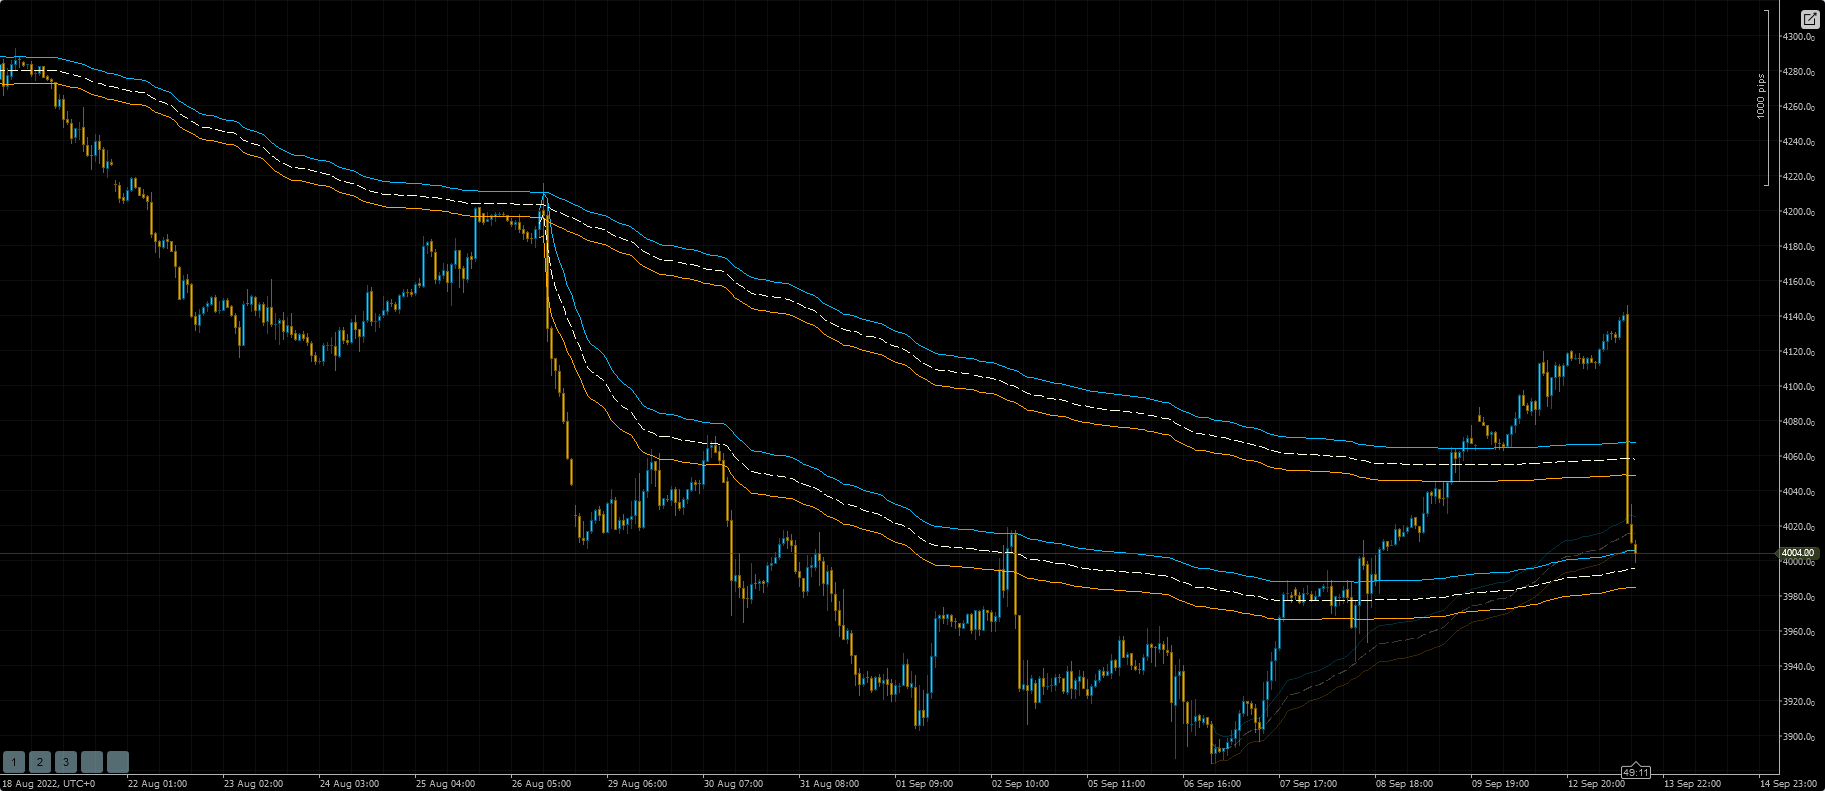
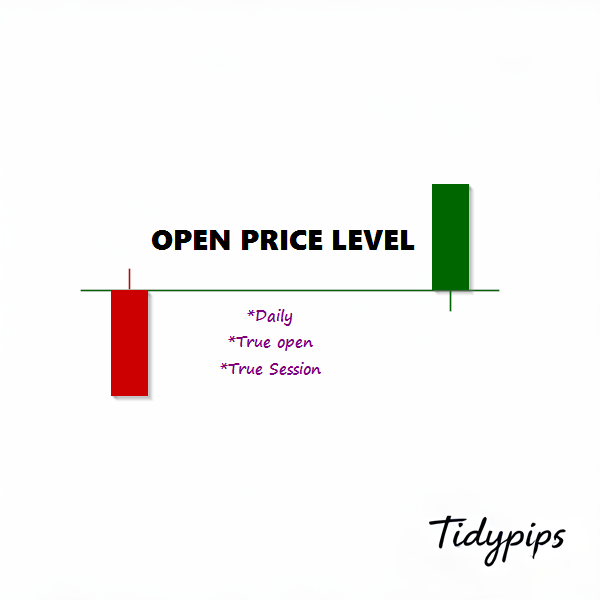
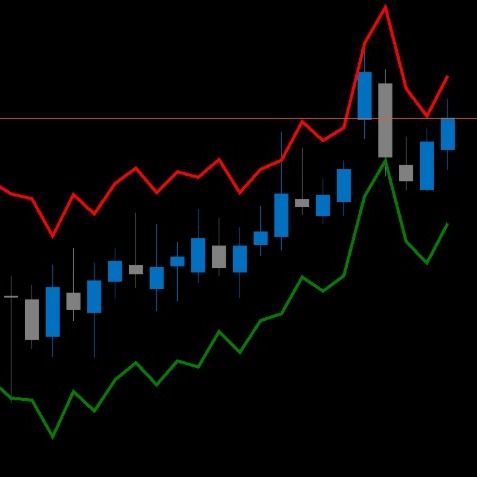
This Fair Value Gap (FVG) Indicator is a technical analysis tool that helps traders identify price imbalances.

Features:

  • Toggle visibility of bullish and/or bearish gaps
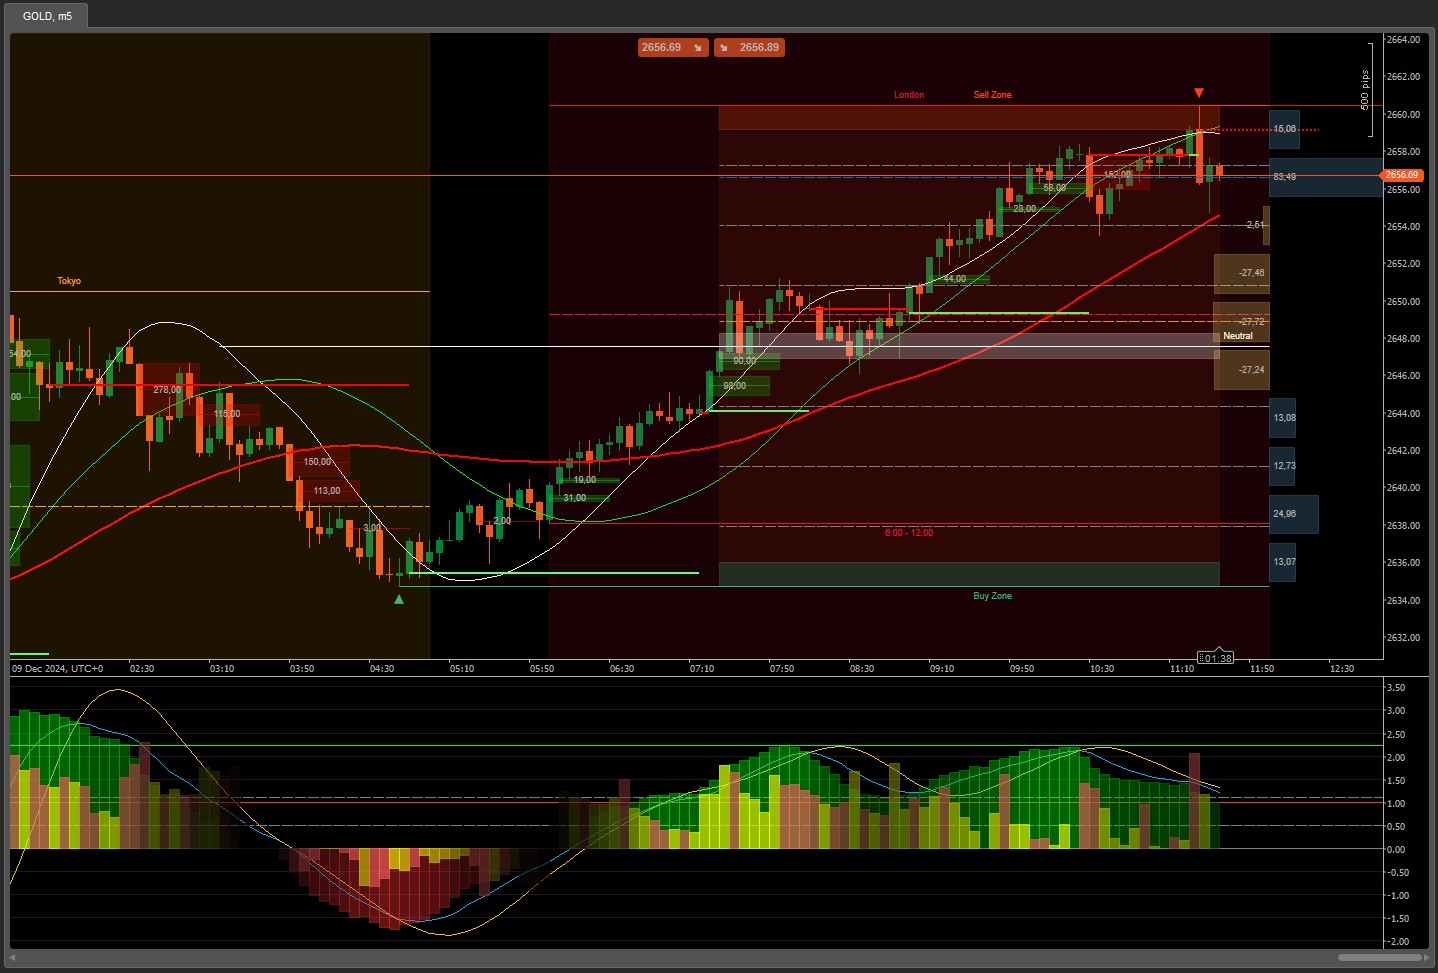
  • Displays color-coded boxes for easy visualization (default: green for bullish, red for bearish, gold for midpoint levels)
  • Adjustable lookback period to reduce chart clatter
  • Configurable box extension setting (offset) for better visualization
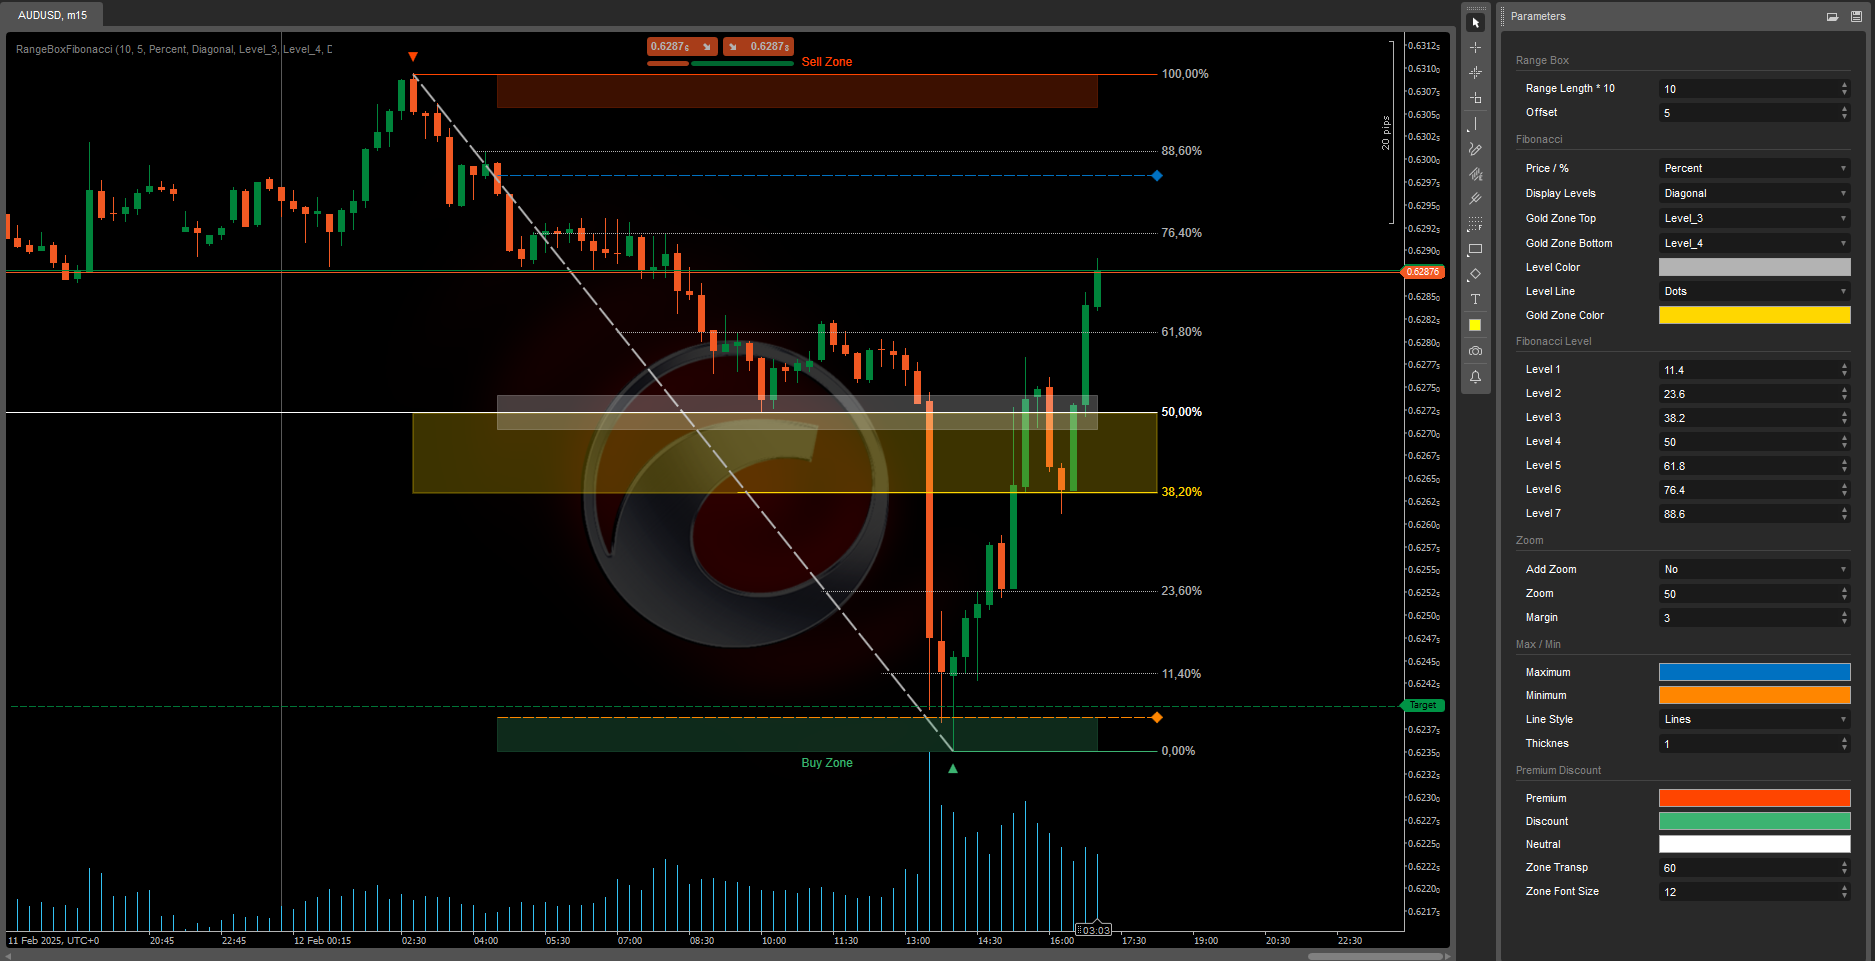
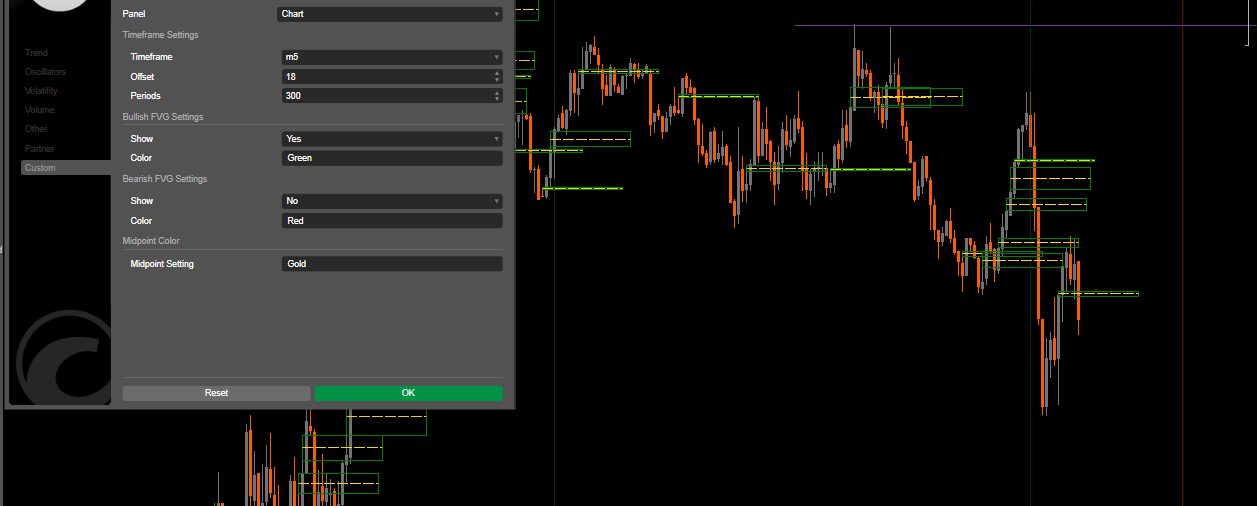
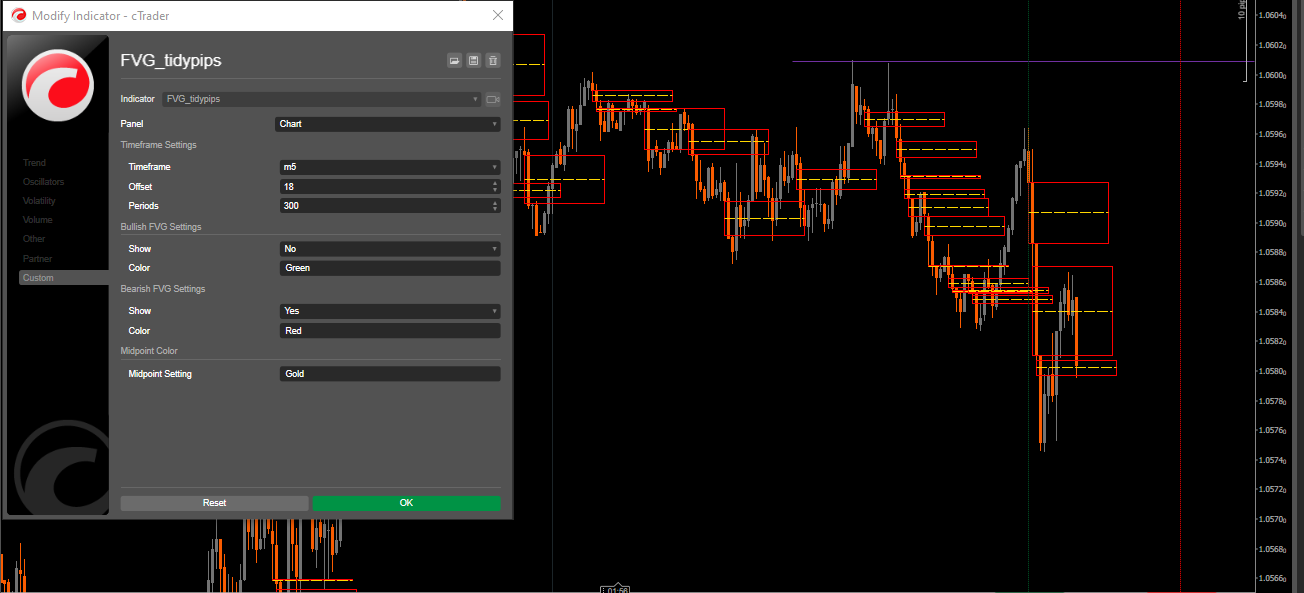
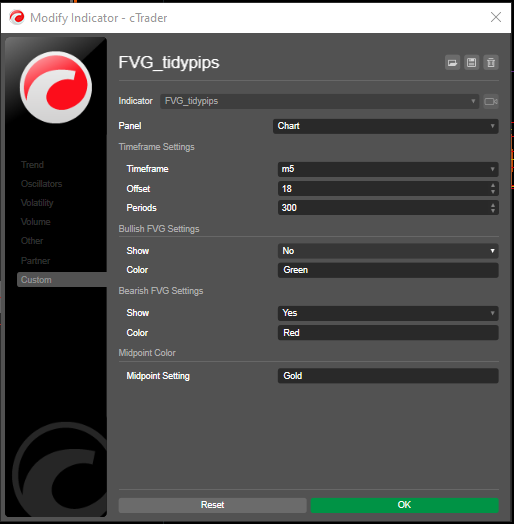
Parameters:

  • Timeframe: Select your preferred timeframe to display FVGs
  • Offset: Adjust the horizontal extension of FVG boxes (3-500)
  • Periods: Set the lookback period for historical FVG calculation
  • Show Bullish/Bearish FVGs
  • Colours: Customize colours for bullish FVGs, bearish FVGs, and midpoint lines

Trading Applications:

  • Support and Resistance: FVGs often act as strong support/resistance levels
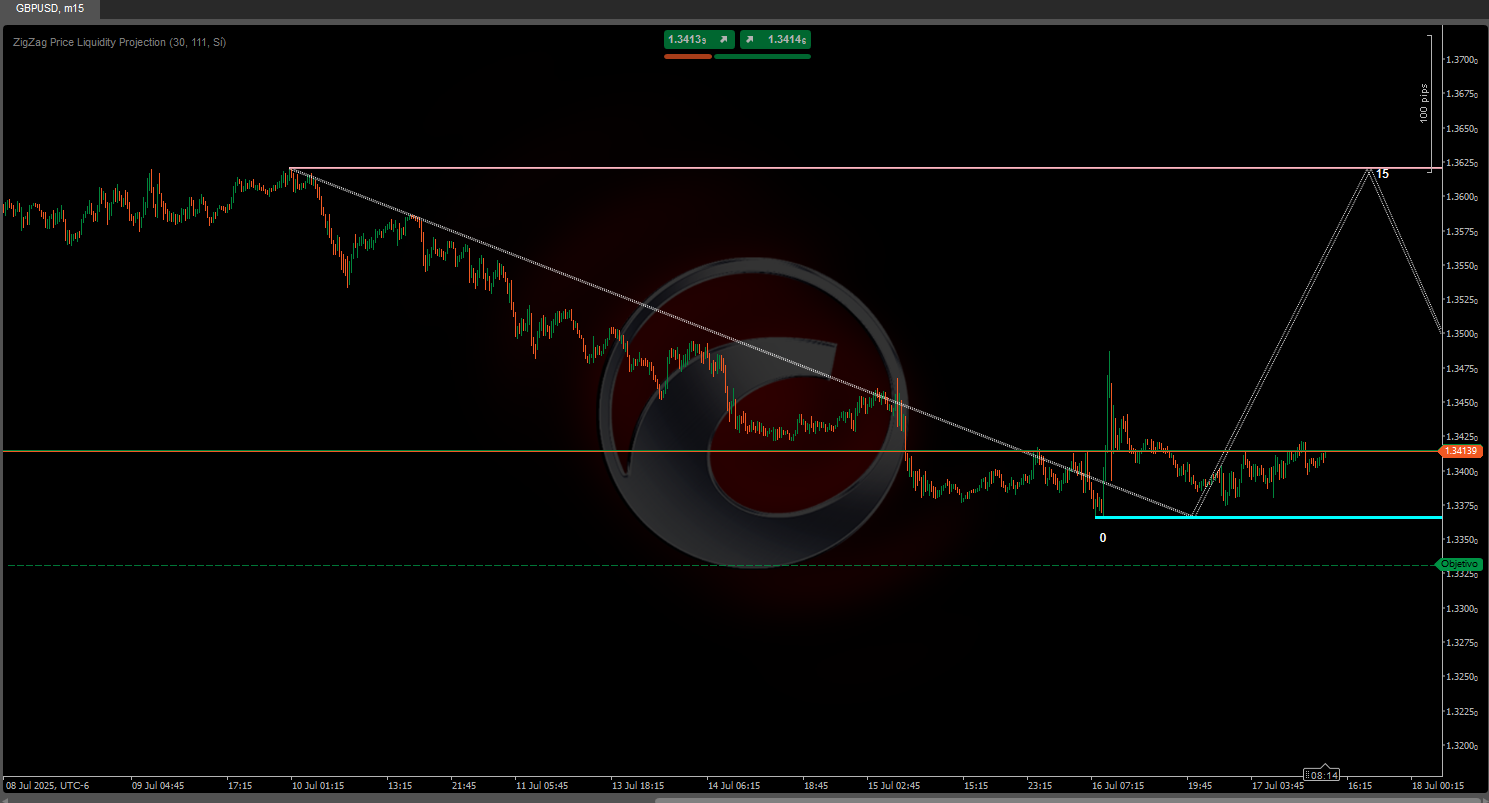
  • Price Magnets: Unfilled gaps tend to attract price action (DOL)
  • Market Structure: Help identify potential reversal zones and continuation points of interest
  • Order Block Analysis: Spot institutional trading zones

Best Application Practices:

  • Use in conjunction with other technical analysis tools.
  • Higher timeframes produce more significant FVGs, Lower timeframes FVG used with Higher timeframe Directional Bias
  • Monitor how price reacts when returning to FVG zones
  • Pay attention to the midpoint line as it often serves as a price magnet

    Check out other useful indicators that I’ve published. If you find this one—or any of my other indicators—helpful, consider supporting my work by purchasing or donating. Your support not only helps me continue developing and improving these tools, but it also ensures I can keep creating new, valuable indicators to enhance your trading experience. Thank you for your continued support!

    https://buymeacoffee.com/tidypips
More from this author
ICT Killzone and Sessions high_low
This indicator is an essential tool for traders seeking to visualize key trading sessions on their charts.
Daily Open Pivot Level
This indicator is a valuable tool for traders looking to identify significant opening price level of any asset.
Previous Day Liquidity Zones (PDH - PDL)
Useful indicator for traders who want to visualize key price levels based on previous daily highs and lows.
Indicator
XAUUSD
Commodities
True Open Pivot Levels
This indicatorFull Description: Th shows the open price lines at key market times based on Eastern Standard Time (EST).
Moving Average channel
This indicator is designed to display customizable moving averages (MAs) on a chart.
Previous Day Equilibrium (Premium & Discount)
Plots the equilibrium price levels based on previous daily highs and lows.
Drawing Utility
A rectangular box with 5 adjustable Fibonacci level or even custom ones.
You may also like
Indicator
Indices
Commodities
Forex
+2
Two Candle Patterns
Detect powerful 2-candle reversal patterns at key highs/lows. Boost entries with real-time alerts and visual signals.
Cumulative Delta_noSourceCode
Demo of my main indcator.
Goldenhours
TheĀ Session Golden HoursĀ indicator is designed for serious traders looking to visualize high-probability
Premium Discount Zones
Premium Discount Zones" spots key areas (🟣Premium/🟢Discount) using recent highs/lows & volume..............
Supertrend TV
REAL Supertrend because default Ctrader Supertrend gives different signals
BarCount
Bar count
Indicator
Indices
XAUUSD
Commodities
+8
ATR on Chart
Plots the ATR on the chart for easy visualization.
Indicator
Breakout
Signal
Bollinger
[Hamster-Coder] Bollinger Bands
Bolliger Bands + Hamster-Coderā„¢ Timeframe Decoupling
Anchored VWAP Buttons
Market BIAS Detector
The Market BIAS Detector is a smart trading assistant designed to identify the market.
Indicator
Stocks
Forex
MACD
MACDVolume
šŸ˜ŽRead the description before purchasingšŸ’©
ZigZag Price Liquidity Projection
šŸ“Š ZigZag Liquidity Projection: Predict bounces/breaks using pivots, ATR & volume.
Indicator
Grid
NAS100
NZDUSD
+15
RangeBoxFibonacci
With this Fibonacci retracement indicator, traders have full control over the retracement levels displayed on the chart.
Indicator
Indices
Commodities
CCI - With Arrows and 40 80 EMA Logic_noSourceCode
The Advanced CCI & EMA Indicator combines the CCI with 40 & 80 EMA logic to generate precise arrows signaling direction
Larry Williams 9.1
Larry Williams 9.1
Reko Wic
Visualize global Forex trading sessions with clear time blocks for better timing and strategy planning.
R S
This indicator is a simple, single-timeframe tool for showing candle sentiment directly on your chart. If you want a mor
Automatic Fibonatti - Renko
Automatically plots Fibonacci retracement levels using the highest and lowest points of a customizable time range.