Chaikin Money Flow
"Chaikin Money Flow" logo
5.0
03/09/2025
92
Desktop
Since 03/10/2024
Sales
1
Free installs
5128
"Chaikin Money Flow" uploaded image"Chaikin Money Flow" uploaded image"Chaikin Money Flow" uploaded image

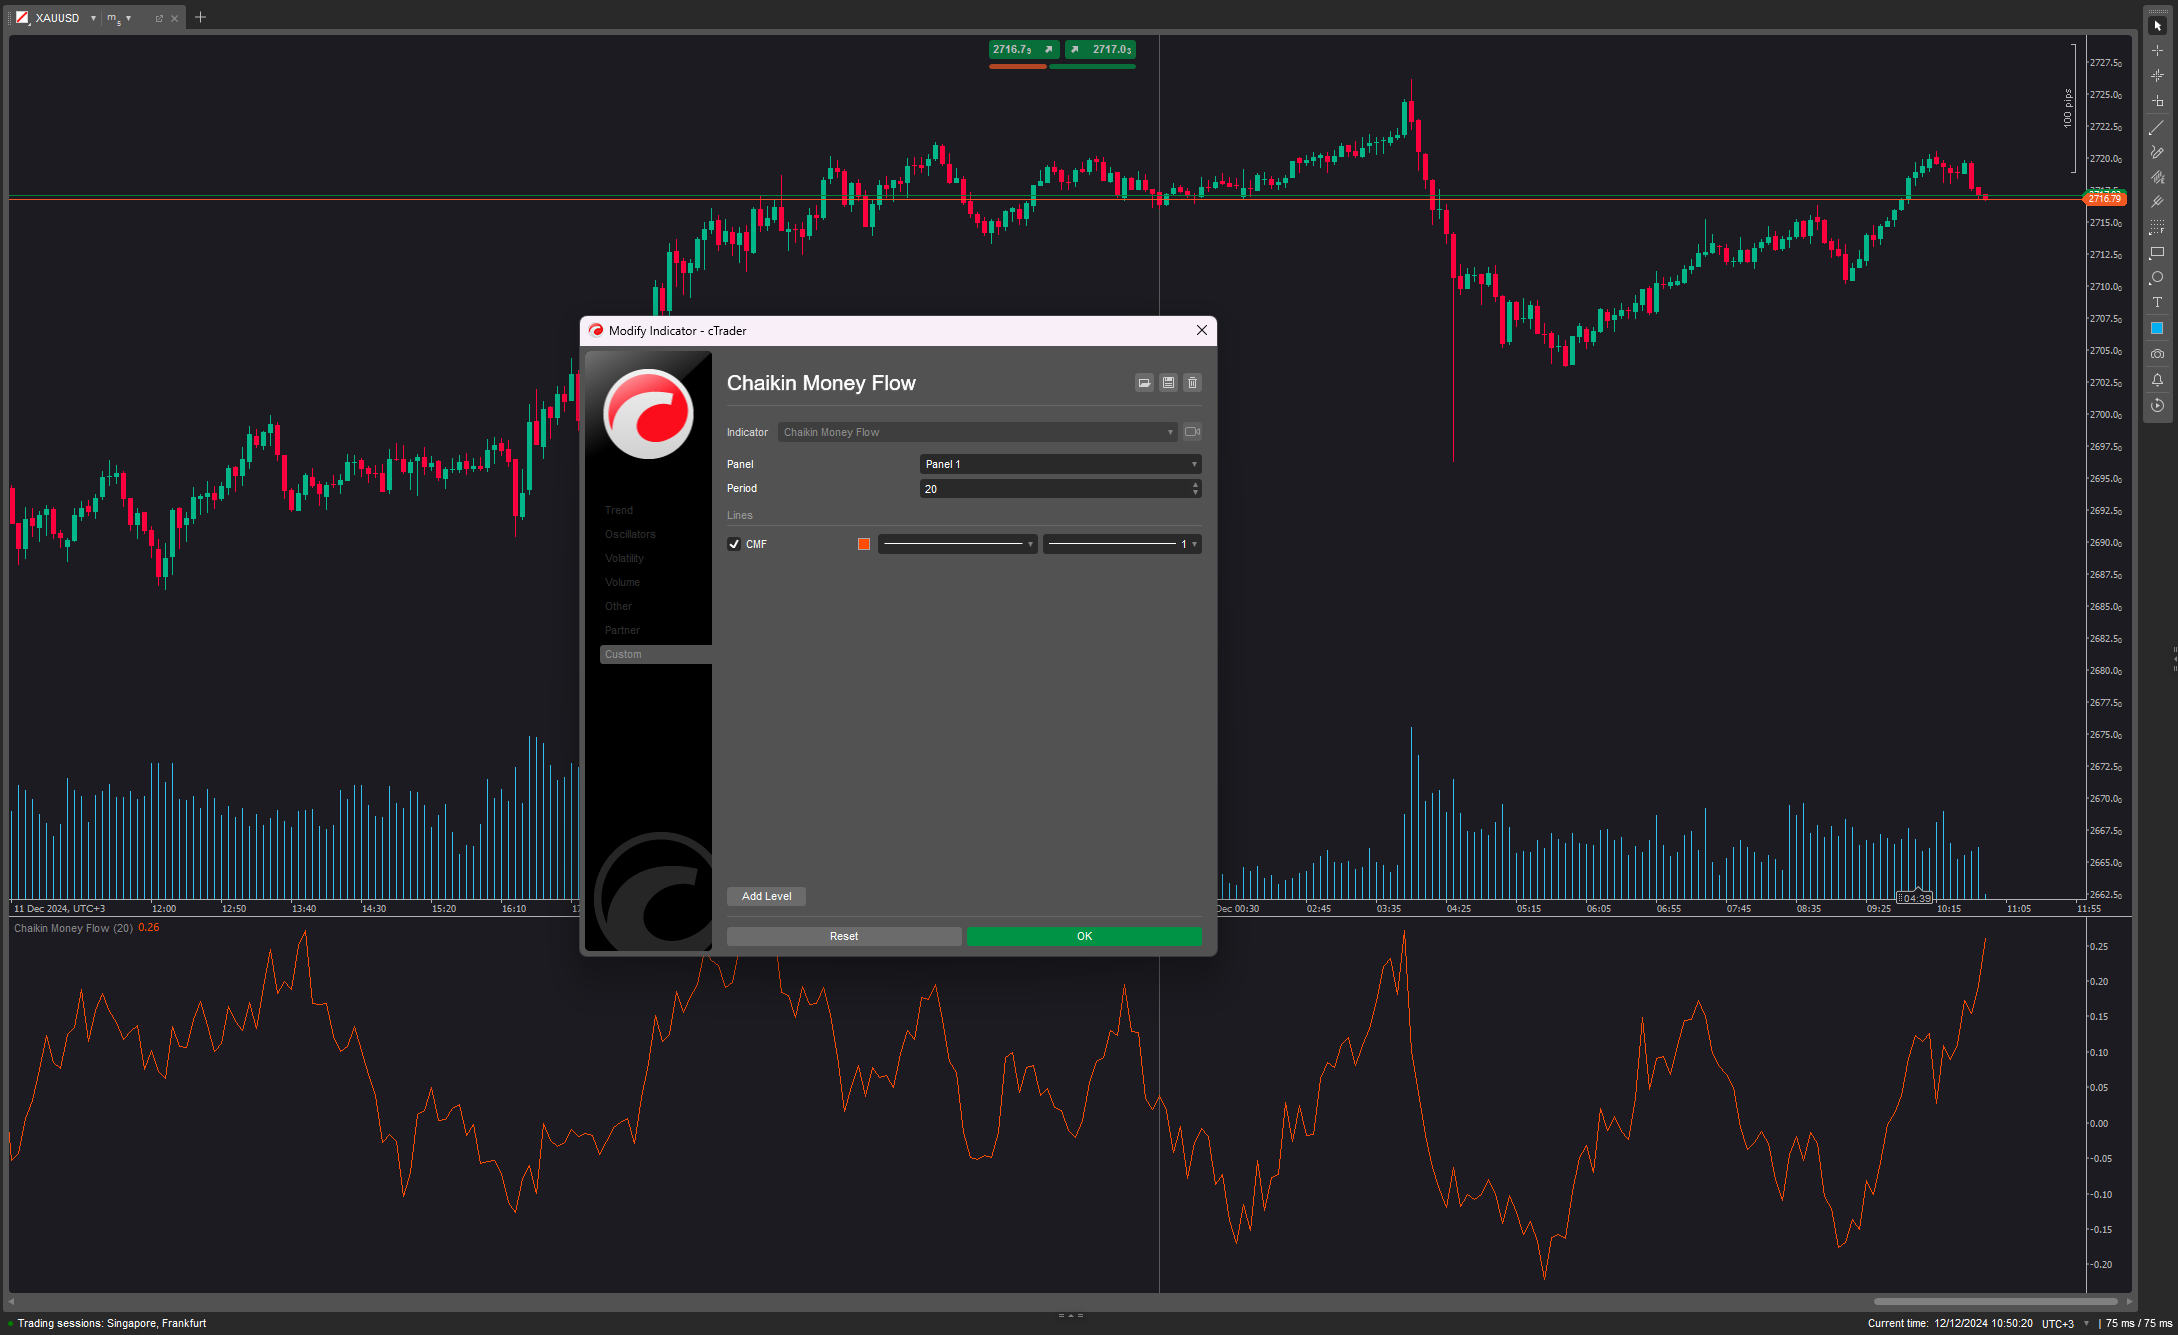
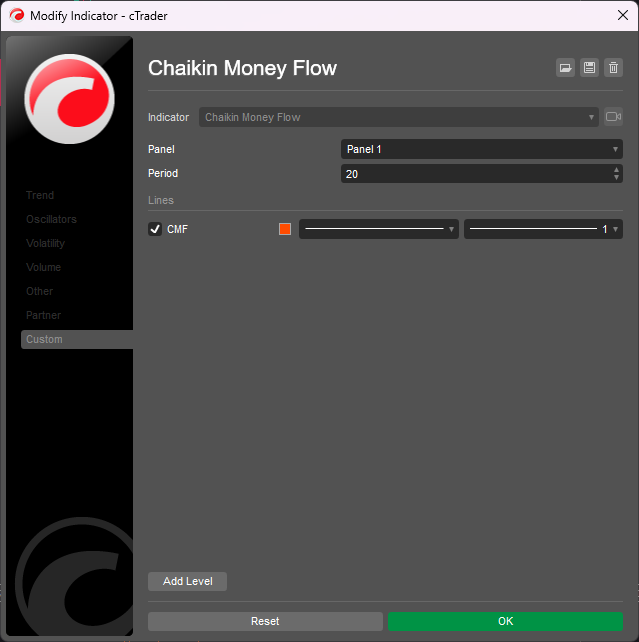
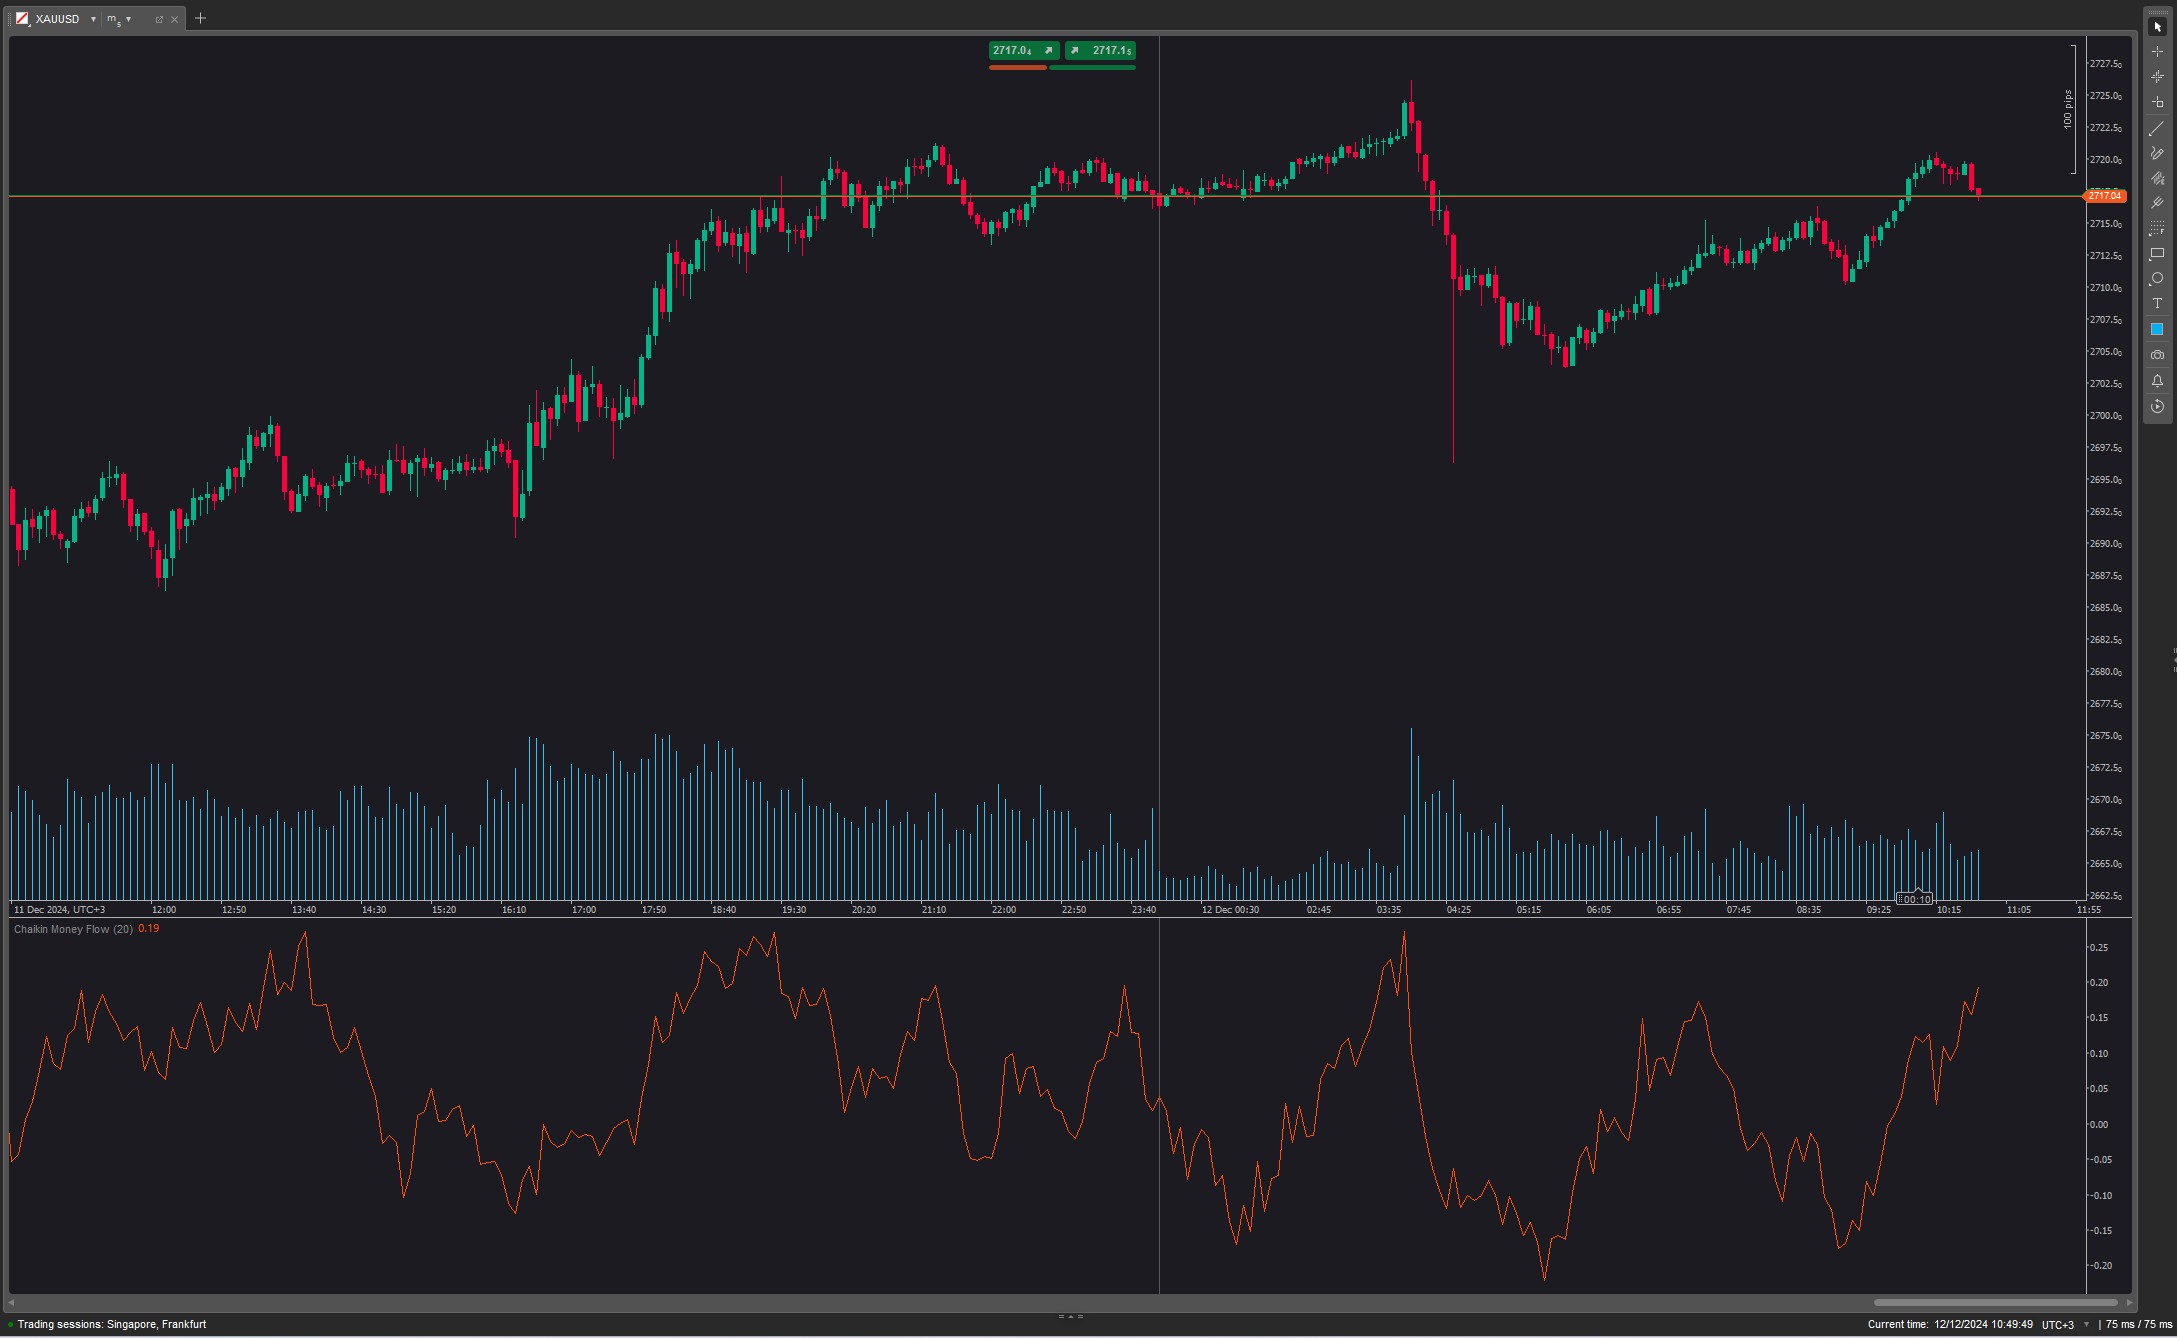
Chaikin money flow's primary purpose is to distinguish between periods of accumulation and distribution of a security. When the indicator is above the zero line, it indicates the security is experiencing net accumulation, suggesting that investors are buying the asset.

  • Chaikin Money Flow settings with values over 30 make the indicator less sensitive. This will result in fewer, but better quality signals.
  • Chaikin Money Flow settings with values below 20 make the indicator over-sensitive. This will result in more market noise.
  • It indicates a continued uptrend when the CMF indicator crosses the zero line from above and generates long/buy signals.
  • It indicates a continued downtrend when the CMF indicator crosses the zero line from below and generates short/sell signals.
More from this author
Top-rated
Free
Indicator
ATR
Supertrend
PMAX
It's a combination of two trailing stop loss and the other one is well-known ATR-based SuperTrend.
cBot
VWAP
RSI
Breakout
+5
Investion X V1.9 - Intelligent Filter-Based Trading System
Trading system combining martingale strategy with multi-layered technical analysis and comprehensive protection features
MultiTimeFrame Moving Averages
3 moving averages with different periods and different time frames.
Indicator
Indices
AI
Machine Learning Momentum Index
The Machine Learning Momentum Index (MLMI) represents the next step in oscillator trading.
Indicator
RSI
Indices
StochasticRSI
Stochastic RSI (StochRSI) is a technical indicator used to measure the strength and weakness of the RSI.
Laguerre RSI
Laguerre RSI is based on John EHLERS' Laguerre Filter to avoid the noise of RSI.
KDJ
The KDJ oscillator display consists of 3 lines (K, D and J - hence the name of the display) and 2 levels.
Indicator
Breakout
Forex
On Balance Volume
On Balance Volume (OBV) measures buying and selling pressure as a cumulative indicator.
Quantitative Qualitative Estimation
The QQE (Quantitative Qualitative Estimation) Weighted Oscillator improves its original version by weighting the RSI.
Indicator
Breakout
Stocks
Signal
Darvas Box
The Darvas Box involves identifying "boxes" or trading ranges where a stock's price consolidates before breaking out.
Indicator
Indices
Breakout
Stocks
+3
Ichimoku Cloud Indicator
The Ichimoku Cloud is a comprehensive technical analysis system developed by Japanese journalist Goichi Hosoda
cBot
Grid
Martingale
Investion Basic
This is a basic martingale bot without an indicator. For long and short trading options at the same bot.
You may also like
Indicator
RSI
XAUUSD
Breakout
+6
Market Imbalance
Identifies market imbalances and visually marks key areas based on price patterns and volatility (ATR).
Ctreder Smart SMA Indicator
cTreder Smart SMA
Indicator
RSI
Signal
MA-RSI HTF Confirmation
MA-RSI HTF Confirmation: Eliminate false signals and trade with confidence!
Indicator
Breakout
PDHL
PDHL - Previous Day High&Low
Top-rated
Free
FairValueGap
This Fair Value Gap (FVG) indicator is a technical analysis tool used to identify potential price imbalances.
Order Flow
Volumen Delta", es una representación visual del flujo de órdenes basada en el volumen de transacciones.
SmartLiquidityZonesPRO
Smart Liquidity Zones PRO auto-detects liquidity grabs, wicks, traps & manipulations — trade like the smart money.
E7 cTrader User ID
cTrader ID
zh-cn Variety Period time panel(multilanguage)
This indicator can be used to: change color, shape size, position, change font, increase or decrease, and other function
Indicator
Indices
Prop
Stocks
+5
New Way Sar - Free
The Parabolic SAR, or "Stop and Reverse," is a dynamic technical analysis tool
Indicator
RSI
Breakout
XAUUSD
+6
Volume POC Heatmap
📊 Shows volume by price levels, highlights POC, and key zones. Identifies dynamic support/resistance and imbalances.
ICT Killzone and Sessions high_low
This indicator is an essential tool for traders seeking to visualize key trading sessions on their charts.
Indicator
NAS100
NZDUSD
XAUUSD
+13
Market Swing Structure Pullback Pro
Auto-detect support and resistance & structure, highlight pullbacks/BOS retests, and filter with candle confirmation.
Indicator
XAUUSD
Breakout
Forex
+2
McDonalds Pattern-Bzier Curve
Designed to identify and visualize price reversal patterns using Bézier curves.
VolumeColorBar
Color Volume Bars – Visualize Market Strength Instantly
Indicator
Scalping
ACTO-v1
ACTO: Oscillator tracking average candle duration to anticipate volatility shifts in trading.
Order Block detector PRO
Order Block PRO — Smart Institutional Zone Detector
50 percent
This indicater is a magical impact which shows exactly high and low with 100% results