[Stellar Strategies] Market Regime Filter
!["[Stellar Strategies] Market Regime Filter" logo](https://market-prod-23f4d22-e289.s3.amazonaws.com/cb84a98c-46f6-4cfd-b0ba-16518a618cb1_cT_cs_4141285_EURUSD_2025-04-20_16-50-30.png)
03/09/2025
51
Desktop
!["[Stellar Strategies] Market Regime Filter" uploaded image](https://market-prod-23f4d22-e289.s3.amazonaws.com/7a24e7bb-1de7-4d1a-b333-042aea47a5fe_7BIxh2bGAz.png)
!["[Stellar Strategies] Market Regime Filter" uploaded image](https://market-prod-23f4d22-e289.s3.amazonaws.com/a63991e9-6e9f-40fc-8020-177855acc587_cT_cs_4141285_EURUSD_2025-04-20_17-08-00.png)
!["[Stellar Strategies] Market Regime Filter" uploaded image](https://market-prod-23f4d22-e289.s3.amazonaws.com/cc41ffad-7c58-463e-92c1-0f6dbd0266cc_cT_cs_4141285_NAS100_2025-04-20_17-14-25.png)
!["[Stellar Strategies] Market Regime Filter" uploaded image](https://market-prod-23f4d22-e289.s3.amazonaws.com/2ab20840-b276-4b40-ad03-30776512c3a4_cT_cs_4141285_FRA40_2025-04-20_17-15-02.png)
Market Regime Filter Indicator for cTrader
Overview:
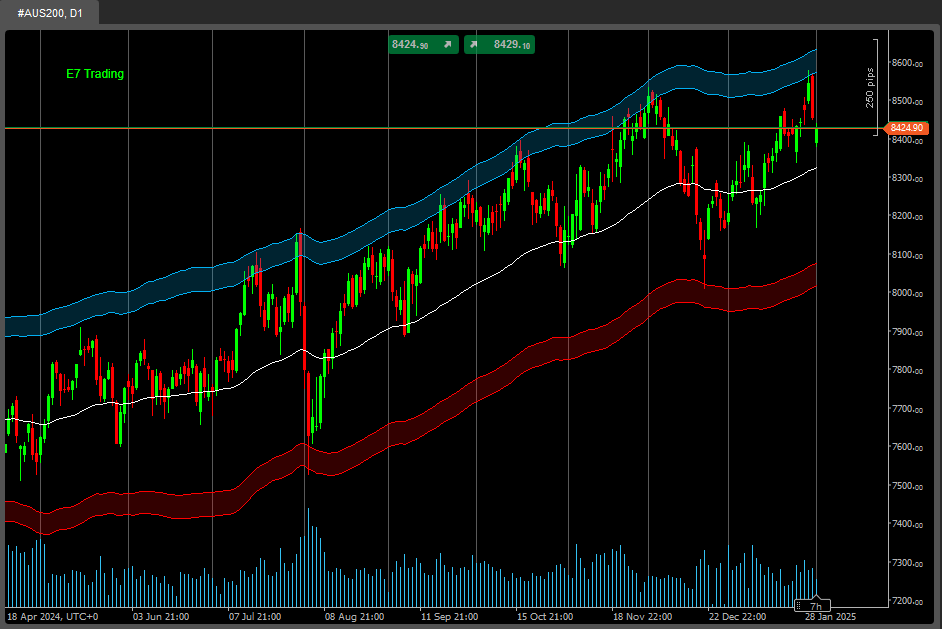
This indicator attempts to classify the current market condition or "regime" based on a combination of technical inputs. Its primary purpose is to help traders understand the prevailing market environment (trending, ranging, volatile) to potentially filter trading signals or adjust their strategy accordingly.
It analyzes:
- Trend Direction & Strength: Using Exponential Moving Averages (EMAs) and the Average Directional Index (ADX).
- Volatility: Using either Average True Range (ATR) or Bollinger Band Width.
- Volume: Optionally using Tick Volume compared to its moving average to confirm trend strength.
Features:
- Multiple Regime States: Classifies the market into distinct states:
- Strong Bull / Strong Bear
- Weak Bull / Weak Bear
- Bull Pullback / Bear Pullback (Temporary counter-moves within a trend)
- Range High Vol / Range Low Vol
- Initializing (During indicator startup)
- Selectable Volatility Measure: Choose between ATR or Bollinger Band Width via parameters (
Volatility Source). - Regime Persistence Filter: Requires a new regime to persist for a minimum number of bars (
Min Bars In Regime) before confirming the change, reducing noise. - Optional Volume Filter: Allows filtering strong trend signals based on whether volume is significantly above its moving average (
Enable Volume Filter). - Sound Alerts: Provides optional sound notifications (
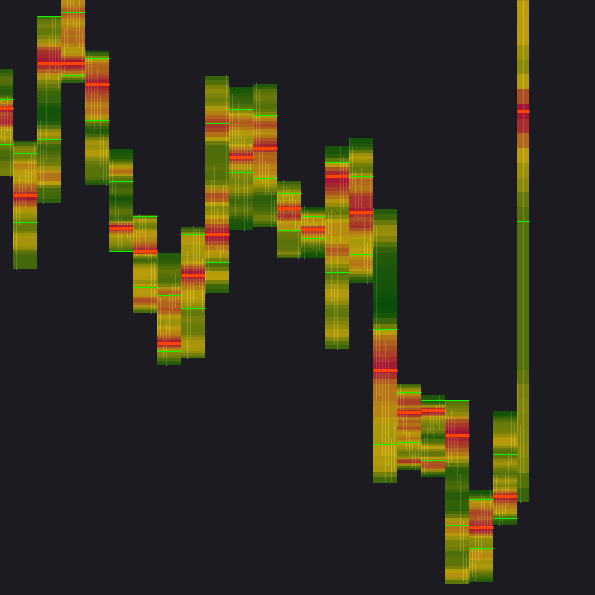
Enable Sound Alert) when the confirmed market regime changes. - Histogram Output: Displays the current confirmed regime as a histogram in the indicator sub-window. The height corresponds to the regime's numerical value (see reference below).
- Text Label: Shows the name of the current confirmed regime in the top-right corner of the indicator window for quick reference.
How to Use:
- Apply to Chart: Add the "Market Regime Filter" indicator to your cTrader chart.
- Configure Parameters: Adjust the input parameters to suit the specific instrument, timeframe, and your trading style. Key parameters include:
- MA Periods (Fast/Slow)
- ADX Settings (Period, Thresholds)
- Volatility Source and its settings (ATR/BB Width)
- Min Bars In Regime (Confirmation setting)
- Volume Filter settings (Enable, Period, Factor)
- Alert settings
- Interpret Histogram: The histogram level indicates the current confirmed regime. Refer to the numerical values below. Generally:
- Higher values (6-8): Bullish conditions.
- Lower values (1-3): Bearish conditions.
- Middle values (4-5): Ranging conditions.
- Pullback values (2, 7): Potential counter-trend moves within a larger trend.
- Filter Signals: Use the regime reading as a context filter for signals from other indicators or strategies.
- Example: Only consider long trend-following signals when the regime is Strong Bull, Bull Pullback, or Weak Bull. Only consider range-based signals (e.g., oscillator reversals) when in Range Low Vol or Range High Vol.
- Adapt Strategy: Adjust trade management based on the regime.
- Example: Use wider stop-losses or let profits run longer during Strong Trend regimes. Consider tighter profit targets during Range Low Vol regimes. Be cautious during regime transitions.
- Use Text Label: Glance at the text label for an immediate understanding of the current state.
- Enable Alerts: Turn on sound alerts if you want notifications for regime changes.
What to Watch For:
- Parameter Sensitivity: The indicator's performance is highly dependent on the chosen parameters. Settings that work well on one timeframe or market may not work on another. Backtesting and optimization are recommended.
- Lag: As the indicator relies on moving averages and other lagging components (like ADX), regime changes will be identified with some delay after the actual market shift.
- Whipsaws/Transitions: Markets don't always transition cleanly between regimes. Expect potential whipsaws (quick flips back and forth) especially around range boundaries or when trends weaken. The
Min Bars In Regimeparameter helps reduce this but doesn't eliminate it. - Volume Reliability: The volume filter uses Tick Volume, which may not represent true market volume, especially in decentralized markets like Forex. Use this filter with discretion.
- Context is Crucial: This indicator provides one view of the market. Do not use it in isolation. Always consider price action, support/resistance levels, chart patterns, and potentially other indicators for confirmation.
- Initialization: The indicator requires a certain number of historical bars (
Required Barsvalue printed in the Automate > Log tab on startup) to fully initialize its calculations. Ensure sufficient data is loaded on your chart.
Regime Histogram Values (Reference):
8: Strong Bull7: Bull Pullback6: Weak Bull5: Range High Vol4: Range Low Vol3: Weak Bear2: Bear Pullback1: Strong Bear0: Initializing
More from this author
!["[Stellar Strategies] BOS Trend 1.0" logo](https://market-prod-23f4d22-e289.s3.amazonaws.com/808c7722-ba53-4633-b8a4-16f31eeb1fc2_[Stellar Strategies] BOS Trend.jpg)
!["[Stellar Strategies] MARSI Signal Plotter" logo](https://market-prod-23f4d22-e289.s3.amazonaws.com/ce01bd9f-8907-48d9-a68d-7c0bde6b9704_4aDZjo80P5.png)
!["[Stellar Strategies] Market Structure Breakout" logo](https://market-prod-23f4d22-e289.s3.amazonaws.com/99d762b3-fbbe-489d-9c19-e72c41ffe387_cT_cs_4141285_EURUSD_2025-04-21_20-25-12.png)
!["[Stellar Strategies] Market Session Ultimate" logo](https://market-prod-23f4d22-e289.s3.amazonaws.com/92b85b76-697c-4a8f-811f-ddd63eb8f9c8_cTrader_oSHtUgCtNJ.png)
!["[Stellar Strategies] Wave Trend Pro" logo](https://market-prod-23f4d22-e289.s3.amazonaws.com/8c93438a-6b0a-4026-93b2-0694329a3bc1_cT_cs_4141285_EURUSD_2025-04-25_17-52-31.png)
!["[Stellar Strategies] Inside Bar with Signals" logo](https://market-prod-23f4d22-e289.s3.amazonaws.com/c12d088e-7b52-4961-a0d2-7e38a2499bd3_cT_cs_4141285_EURUSD_2025-07-15_13-15-32.png)
!["[StellarStrategies] Scheduled Trade Executor" logo](https://market-prod-23f4d22-e289.s3.amazonaws.com/f13e96a0-274f-490e-8aa5-5a154d8bcf60_stellar12.jpg)
!["[Stellar Strategies] Linear Regression Candles 1.1" logo](https://market-prod-23f4d22-e289.s3.amazonaws.com/19ef277f-e0b6-48ef-8941-88bfbba145f3_cT_cs_4141285_EURUSD_2025-03-30_19-53-31.png)
!["[Stellar Strategies] Visual Trend Momentum" logo](https://market-prod-23f4d22-e289.s3.amazonaws.com/3835d044-1c21-4909-9d3c-2635f984b93d_visualtrendmomentum.jpg)
!["[Stellar Strategies] QQE" logo](https://market-prod-23f4d22-e289.s3.amazonaws.com/ed4b3af5-54e4-404e-80eb-a23fa7ef0282_cTrader_7oDDAbSmSP.png)
!["[Stellar Strategies] Moving Averages Combined 1.0" logo](https://market-prod-23f4d22-e289.s3.amazonaws.com/b4cd360c-5f3c-4902-b2e1-6b86da1199bb_Gemini_Generated_Image_nl1erpnl1erpnl1e.jpg)
!["[Stellar Strategies] SP500 Gap Closure cBot 1.0" logo](https://market-prod-23f4d22-e289.s3.amazonaws.com/62a77232-02a9-423b-a5e4-bd2c2bc8db97_cT_cs_4141285_US500_2025-03-21_17-12-57.png)
!["[Stellar Strategies] Ultimate Trend & Momentum Dashboard" logo](https://market-prod-23f4d22-e289.s3.amazonaws.com/d8a894f3-34df-4f37-b4a3-c37e971e4e1f_cT_cs_4141285_NAS100_2025-06-24_17-12-20.png)
You may also like

.jpg)

.jpg)

.jpg)

!["[Hamster-Coder] Bollinger Bands" logo](https://market-prod-23f4d22-e289.s3.amazonaws.com/1114cb2b-7120-42b3-8f53-dbc26968e6af_Icon300.jpg)