
Indicador Avanzado de Zonas Donchian para cTrader
¡Domina las Tendencias del Mercado y las Rupturas con Precisión!
Lleva tu trading al siguiente nivel con el Indicador Avanzado de Zonas Donchian – una herramienta poderosa diseñada para traders que exigen precisión, flexibilidad y eficiencia. Este indicador de próxima generación mejora los Canales Donchian clásicos al introducir análisis multitemporal, cálculos de precio personalizables, alertas en tiempo real y visualización en nube.
Ya sea que operes forex, acciones o materias primas, el Indicador Avanzado de Zonas Donchian te equipa con las herramientas para identificar rupturas, seguir tendencias y operar reversiones como un profesional.
Características y Beneficios Clave:
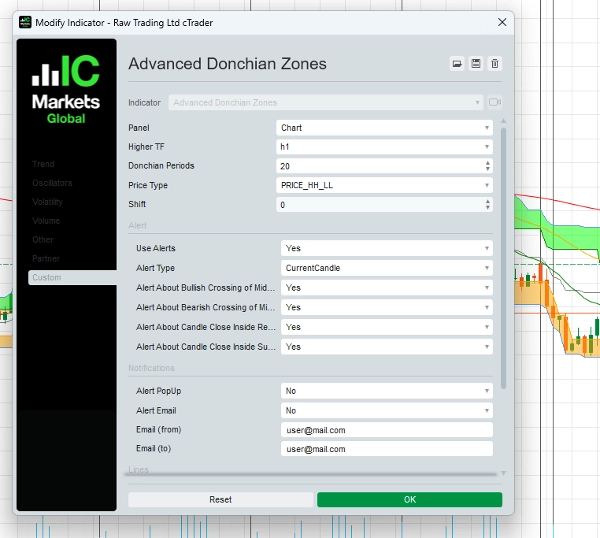
1. Zonas Donchian Multitemporales
- Analiza las Zonas Donchian desde un marco temporal superior mientras operas en uno inferior, asegurando que siempre te alineas con la tendencia mayor del mercado.
- Ideal para traders diarios y swing traders que buscan optimizar sus entradas y salidas.
2. Cálculo de Precio Personalizable
- Elige entre cinco tipos avanzados de precio para refinar tu estrategia:
-
- Máximo Alto / Mínimo Bajo
- Promedio de Alto/Apertura o Alto/Cierre
- Máxima Apertura / Mínima Apertura
- Máximo Cierre / Mínimo Cierre
- Adapta el indicador para adecuarlo a tu estilo de trading y gestión de riesgos.
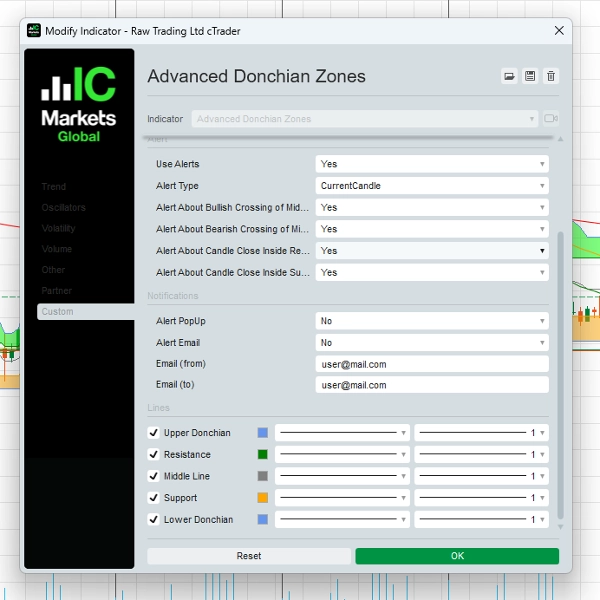
3. Alertas Dinámicas – ¡Nunca Pierdas una Oportunidad!
- Recibe notificaciones en tiempo real cuando ocurran eventos clave de trading:
-
- Cruces de la línea media (señales alcistas o bajistas)
- Cierre del precio dentro de zonas clave (zonas potenciales de reversión o ruptura)
- Alertas disponibles vía ventanas emergentes y correo electrónico, manteniéndote adelantado a los movimientos del mercado.
4. Visualización en Nube para Perspectivas Claras
- Zonas sombradas únicas entre niveles Donchian ayudan a los traders a identificar visualmente áreas de soporte, resistencia y ruptura de forma rápida y efectiva.
5. Parámetro de Desplazamiento Flexible
- Ajusta la posición de las Zonas Donchian hacia adelante o hacia atrás en el tiempo para afinar tu estrategia de trading.
6. Interfaz Fácil de Usar
- Diseñado para traders de todos los niveles, con un diseño intuitivo y configuraciones personalizables para adaptarse a tus preferencias de trading.
Cómo Usar el Indicador Avanzado de Zonas Donchian
1. Estrategia de Trading de Ruptura – ¡Captura Movimientos Explosivos!
- Configuración:
-
- Aplica el Indicador Avanzado de Zonas Donchian a tu gráfico.
- Selecciona un periodo Donchian (por ejemplo, 20) y un marco temporal superior (por ejemplo, 1H o 4H) para señales más precisas.
- Entrada:
-
- Compra cuando el precio rompe y cierra por encima de la zona Donchian superior.
- Venta cuando el precio rompe y cierra por debajo de la zona Donchian inferior.
- Salida:
-
- Usa la línea media o la zona Donchian opuesta como tu nivel de salida.
- Ejemplo:
-
- Si operas un gráfico de 15 minutos, configura el cálculo Donchian basado en un marco temporal de 1 hora. Cuando el precio rompe por encima del nivel Donchian superior, entra en una operación de compra con un stop-loss cerca de la línea media.
2. Estrategia de Seguimiento de Tendencia – Sigue el Momentum del Mercado
- Configuración:
-
- Usa la línea media como filtro de tendencia.
- Opera solo en la dirección de la tendencia predominante.
- Entrada:
-
- Compra cuando el precio está por encima de la línea media y rebota en la zona de soporte.
- Venta cuando el precio está por debajo de la línea media y rebota en la zona de resistencia.
- Salida:
-
- Cierra la operación cuando el precio cruce la línea media en dirección contraria.
- Ejemplo:
-
- En un gráfico de 4 horas, el precio se mantiene por encima de la línea media, confirmando una tendencia alcista. Entra en una operación de compra cuando el precio retrocede a la zona de soporte y muestra señales de reversión.
3. Estrategia de Trading en Rango – Obtén Ganancias en Mercados Laterales
- Configuración:
-
- Identifica períodos cuando el precio fluctúa entre las zonas Donchian superior e inferior.
- Entrada:
-
- Compra cuando el precio se acerca al soporte.
- Venta cuando el precio se acerca a la resistencia.
- Salida:
-
- Toma ganancias cerca de la zona Donchian opuesta o cuando ocurre una ruptura.
- Ejemplo:
-
- En un gráfico de 1 hora, si el precio oscila entre los niveles Donchian superior e inferior, ejecuta operaciones en estos extremos para oportunidades de reversión a la media.
Por Qué los Traders Eligen las Zonas Donchian Avanzadas
✔ Versátil para Diferentes Estilos de Trading – Funciona para rupturas, seguimiento de tendencias y trading en rango.
✔ Mejora la Precisión del Trading – Identifica niveles clave de soporte y resistencia con exactitud.
✔ Alertas en Tiempo Real – Mantente informado con notificaciones instantáneas.
✔ Herramienta de Nivel Profesional – Desarrollada para traders que buscan una ventaja en el mercado.
Precios y Oferta Exclusiva
Precio Especial por Tiempo Limitado: $97 (Pago Único)
Incluye:
- Indicador Avanzado de Zonas Donchian para cTrader
- Guía Completa para el Usuario con estrategias paso a paso
- Actualizaciones Gratuitas por 1 Año
- Soporte Prioritario por Email
Lo Que Dicen los Traders
“He estado usando Canales Donchian durante años, pero este indicador lo lleva a otro nivel. ¡La función multitemporal es un cambio total!”
— Mark S., Trader de Forex
“Las alertas y las configuraciones de precio personalizables me ayudan a captar operaciones de ruptura con más confianza. Muy recomendado para traders serios.”
— Lisa T., Swing Trader
¡Comienza Hoy!
¿Listo para transformar tu trading? Haz clic en el botón abajo para comprar el Indicador Avanzado de Zonas Donchian y comenzar a operar con precisión.
[Comprar Ahora por $97]
Garantía de Devolución de Dinero de 30 Días
Respaldamos nuestro producto. Si no estás completamente satisfecho, contáctanos dentro de 30 días para un reembolso completo – sin preguntas.
¿Necesitas Ayuda? ¡Contáctanos!
📧 Email: o.elmottaqy@gmail.com
🌐 Sitio web: https://t.me/mottaqyo
Aviso de Riesgo
El trading implica riesgos. El Indicador Avanzado de Zonas Donchian es una herramienta para ayudar en tus decisiones de trading pero no garantiza ganancias. Siempre usa una gestión adecuada del riesgo y opera responsablemente.
5 | 50 % | |
4 | 50 % | |
3 | 0 % | |
2 | 0 % | |
1 | 0 % |


