
Description
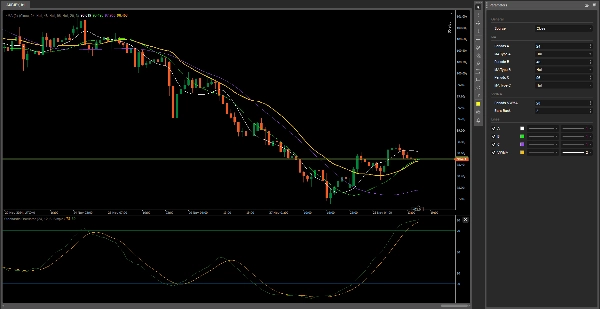
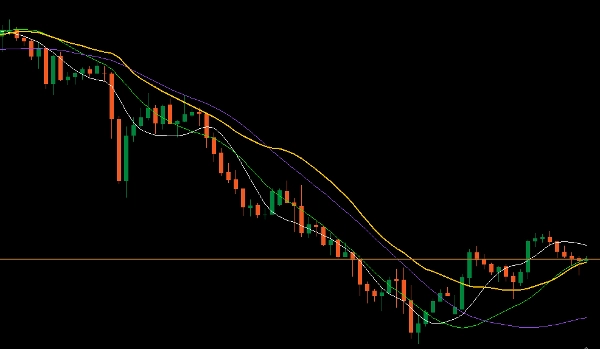
Cet indicateur se compose de 3 moyennes mobiles que vous pouvez configurer à votre convenance, du type de moyenne mobile à ses couleurs, son épaisseur et son type de ligne.
La quatrième est la VWMA (Moyenne Mobile Pondérée par le Volume) – la formule typique pour cet indicateur est - VWMA sur 3 jours = (C1 * V1 + C2 * V2 + C3 * V3) / (V1 + V2 + V3).
Dans cette option, j'ai créé la possibilité de répéter l'intervalle non pas seulement 3 fois mais jusqu'à 500 fois.
J'ai créé cela pour garder le graphique propre.
Les paramètres par défaut sont la moyenne mobile hull qui sont parfaits et les périodes 24, 48, 96 sont plus optimales pour moi dans chaque unité de temps.
Supplémentaire
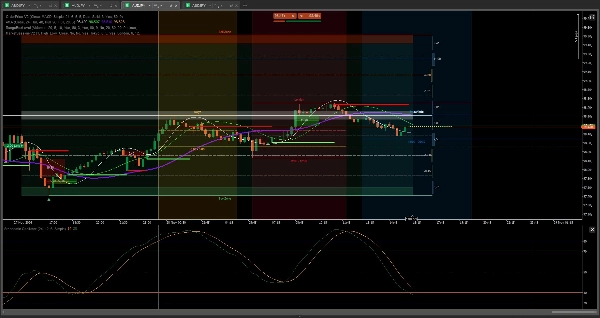
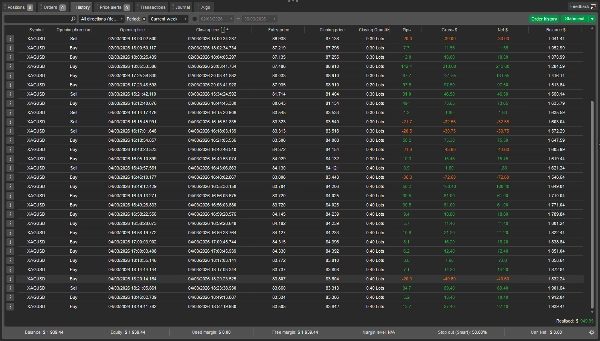
Ce sont les outils qui m'aident à gagner de l'argent
https://ctrader.com/products/3441?u=Thomas-Sparrow
https://ctrader.com/products/526?u=Thomas-Sparrow
https://ctrader.com/products/3137?u=Thomas-Sparrow
https://ctrader.com/products/2913?u=Thomas-Sparrow
Vous serez invincible
Bonne chance 😀
Résumé
Avis clients
5 | 100 % | |
4 | 0 % | |
3 | 0 % | |
2 | 0 % | |
1 | 0 % |


