
Description
https://chartshots.spotware.com/c/695bff3f3bc21
https://chartshots.spotware.com/c/695bffac03fb1
https://chartshots.spotware.com/c/695c0002aabb7
📊 Retracement Fib Automatique
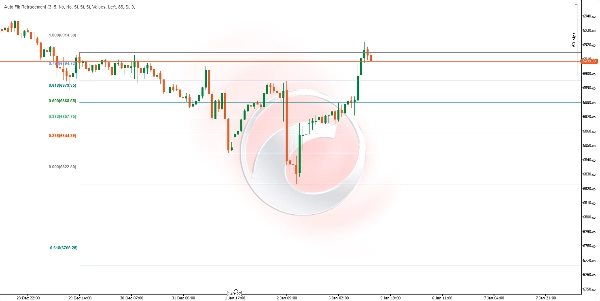
Retracement Fib Automatique est un indicateur d'analyse technique qui trace automatiquement les niveaux de retracement et d'extension de Fibonacci basés sur les mouvements de prix significatifs les plus récents. Contrairement aux outils Fibonacci manuels, cet indicateur détecte automatiquement les points pivots du marché et met à jour les niveaux en temps réel.
⚙️ Comment ça marche ?
Détection automatique des pivots
L'indicateur utilise un algorithme ZigZag dynamique pour identifier les hauts et bas significatifs des prix :
- Lookback (Profondeur) : Définit combien de barres sont analysées en arrière pour confirmer un point pivot. Une valeur plus élevée détecte des oscillations plus grandes ; une valeur plus basse est plus sensible aux mouvements plus petits.
- Sensibilité (Déviation) : Contrôle l'importance qu'un mouvement de prix doit avoir pour former un nouveau pivot. Elle est calculée en multipliant le ATR (Average True Range) sur 10 périodes par ce facteur. Des valeurs plus élevées filtrent le bruit et ne détectent que les mouvements importants.
Calcul des niveaux de Fibonacci
Une fois les deux derniers pivots (un haut et un bas) identifiés, l'indicateur calcule chaque niveau en utilisant la formule classique de Fibonacci :
Niveau = Prix d'ancrage + (Amplitude du mouvement × Ratio de Fibonacci)
Où :
- Prix d'ancrage : Le prix du pivot le plus récent (ou le précédent si la direction s'inverse)
- Amplitude du mouvement : La différence entre les deux pivots
- Ratios disponibles : 0, 0.236, 0.382, 0.5, 0.618, 0.65, 0.786, 1, 1.272, 1.414, 1.618, 1.65, 2.618, 2.65, 3.618, 3.65, 4.236, 4.618, et des niveaux négatifs (-0.236, -0.382, -0.618, -0.65)
📈 À quoi ça sert ?
UseDescription
Identifier les supports et résistances
Les niveaux 0.382, 0.5, et 0.618 sont des zones classiques où le prix a tendance à réagir 🔵
Définir des objectifs de prix
Les niveaux d'extension (1.618, 2.618, 3.618, 4.236) aident à projeter jusqu'où un mouvement pourrait aller 🎯
Planifier les entrées
Cherchez des replis vers des niveaux clés pour entrer dans la direction de la tendance ⬆️⬇️
Placer des stop-loss
Placez les stops au-delà des niveaux Fibonacci pertinents 🛑
Confirmer les zones de retournement
Lorsque le prix atteint des niveaux d'extension extrêmes, cela peut indiquer une fatigue 🔄
🛠️ Comment l'utiliser
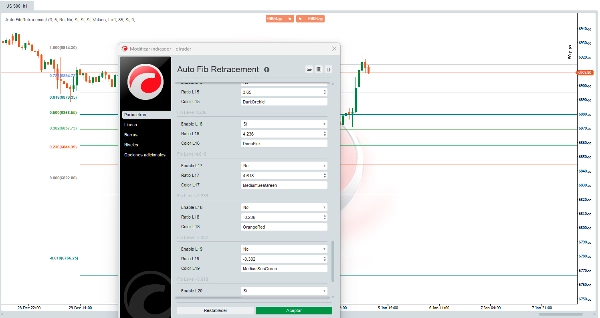
Paramètres principaux
ParamètreDescriptionValeur suggérée
Sensibilité
Multiplicateur de déviation pour filtrer les mouvements mineurs
3 (par défaut)
Lookback
Nombre minimum de barres pour calculer les pivots
10 (par défaut)
Inverser la direction
Inverse le point de référence pour le calcul des niveaux
Désactivé
Options d'affichage
OptionFonction
Étendre à gauche / droite
Étend les lignes horizontales à gauche ou à droite du graphique
Afficher les prix
Affiche le prix exact de chaque niveau
Afficher les ratios
Affiche le ratio de Fibonacci (valeurs ou pourcentage)
Position des étiquettes
Positionne les étiquettes à gauche ou à droite
Opacité de la zone
Contrôle la transparence des zones colorées entre les niveaux
Niveaux Fibonacci configurables
Chacun des 22 niveaux peut être :
- Activé ou désactivé individuellement
- Avoir sa valeur numérique modifiée
- Avoir sa couleur changée
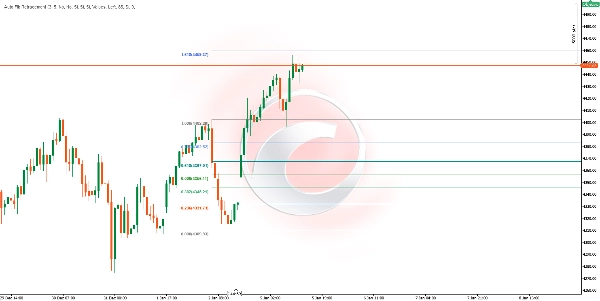
💡 Interprétation des zones
Les zones colorées entre les niveaux consécutifs facilitent l'identification visuelle :
- Zones vertes/bleues (0.382 - 0.786) : Zone de repli sain dans les tendances. Zone commune pour chercher des entrées. ✅
- Zone du niveau 1.0 : Représente 100 % du mouvement précédent. Sert de support/résistance clé. ⚖️
- Zones rouges/roses (1.618+) : Extensions du mouvement. Le prix atteignant ces zones peut indiquer une sur-extension. ⚠️
⚠️Considérations
- L'indicateur se met à jour automatiquement lorsqu'il détecte de nouveaux pivots significatifs
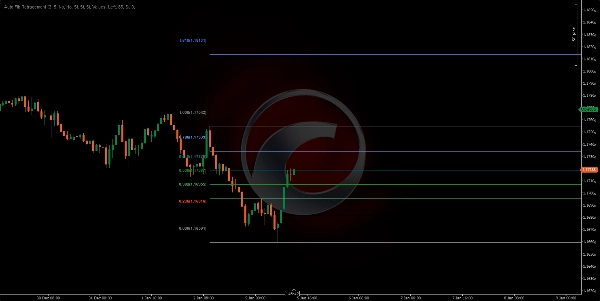
- Il fonctionne sur toutes les unités de temps et actifs financiers
- Les niveaux de Fibonacci sont des zones de probabilité, pas des garanties
- Il est recommandé de l'utiliser en conjonction avec d'autres indicateurs ou l'analyse de l'action des prix
- Sur les marchés en range ou chahutés, les pivots peuvent changer fréquemment
📝 Notes techniques
- L' ATR sur 10 périodes est utilisée en interne pour calculer le seuil dynamique de détection des pivots
- L'indicateur nécessite un minimum de données historiques équivalent au double du paramètre Lookback pour fonctionner correctement
- Les lignes et zones sont redessinées uniquement sur la dernière barre pour optimiser les performances 🚀
Résumé
The indicator helps traders identify potential support and resistance zones, define price targets, plan entries on pullbacks, set stop-losses beyond key levels, and confirm reversal zones when price reaches extreme extensions. It works on any timeframe and financial asset, including Forex, stocks, commodities, indices, and cryptocurrencies such as BTCUSD, EURUSD, GBPUSD, XAUUSD, NAS100, and others.
Users can customize parameters like sensitivity, lookback period, direction inversion, and display options (line extension, price and ratio labels, zone opacity, and colors). Colored zones visually highlight key Fibonacci areas for easier interpretation. The indicator updates automatically with new pivots and redraws levels on the latest bar to optimize performance.


![Logo de "[Stellar Strategies] Linear Regression Candles 1.1"](https://cdn.ctrader.com/image/webp/8b9cff9f-2431-46d2-b0ec-c7f55f4a4a6d_27918)