


Mô tả
THE IDEA
Support and resistance zones that preserve the history and characteristics of price reactions instead of treating every level as just a line.
THE PROBLEM
Traditional support and resistance usually answers one question:
“Where did price react?”
But the location alone does not tell you much about the behavior behind that reaction.
Two levels can appear almost identical on a chart while having very different histories.
One may have been tested repeatedly.
Another may have produced a deep and efficient reaction with relatively little activity.
A horizontal line shows the location.
It does not show how price behaved there.
THE CORE CONCEPT: THE LEVEL SHOWS WHERE PRICE REACTED. THE DATA SHOWS HOW IT REACTED.
Liquidity-Based Support & Resistance treats a level as more than a price coordinate.
A zone is built from the history of price interaction around it.
Instead of reducing a zone to:
“Price reacted here.”
the indicator keeps additional information visible:
- How often price reacted
- How deep the reactions were
- How much tick activity accompanied them
- How efficiently price moved
- Whether activity was absorbed
- How convincing the movement was
The location tells you where.
The measurements help describe how.
The level shows where price reacted. The data shows how it reacted.
WHAT IT DOES
The indicator automatically detects swing points and maps them into adaptive support and resistance zones.
Each zone can retain information about the price reactions that contributed to it.
The resulting zone can be examined through both its location and its underlying measurements.
This allows you to see more of the interaction instead of reducing it to a single horizontal line.
FROM LINES TO ZONES WITH HISTORY
Swing points are mapped into zones around psychological price levels.
Zone spacing adapts to the instrument's typical movement using average swing depth rather than relying on one fixed distance for every market condition.
As new swing reactions occur, the zone can accumulate additional context.
The result is a support/resistance map that develops with price instead of remaining a static collection of lines.
HOW IT WORKS
1. Detect swings
The indicator identifies swing highs and lows using regression-based adaptive swing detection.
2. Map swings to zones
Related swing points are mapped around psychological price levels using adaptive spacing.
3. Measure the reactions
Each zone can be evaluated using several measurements.
4. Build the context
The accumulated information helps describe whether the zone is more associated with supply, demand, or balanced/contested interaction.
The calculations describe what happened.
They do not assume what must happen next.
THE MEASUREMENTS
Depth
Measures the extent of the price movement associated with the swing reaction.
Volume
Shows tick activity associated with the movement.
Efficiency
Examines the relationship between price movement and activity.
Absorption
Highlights situations where activity is present without proportional price progress.
Conviction
Provides another measurement of the relationship between directional price movement and activity.
These measurements are not intended to be isolated signals.
Together, they describe different characteristics of the same price interaction — including activity, efficiency, absorption, conviction, and directional control.
SUPPLY, DEMAND, OR CONTESTED
The zone can be interpreted according to the distribution of swing reactions.
More swing highs create a supply bias.
More swing lows create a demand bias.
A more balanced distribution creates a contested area.
This is a description of the historical interaction around the zone.
It does not mean price must reverse there.
SEE THE DATA, OR SEE THE PATTERN
You can choose how much information to display.
The indicator can expose:
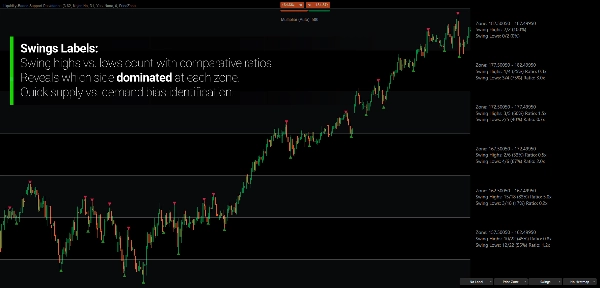
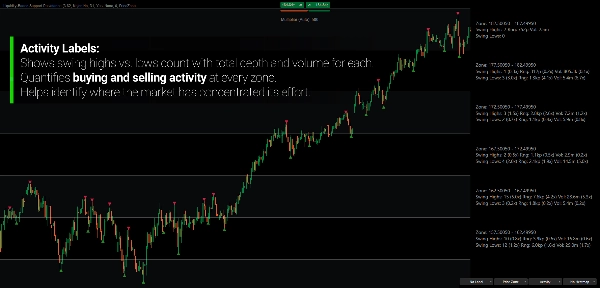
- Swing counts
- Activity
- Directional bias
- Efficiency
- Absorption
- Conviction
- Other zone statistics
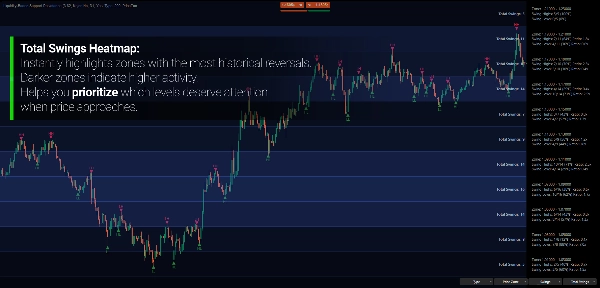
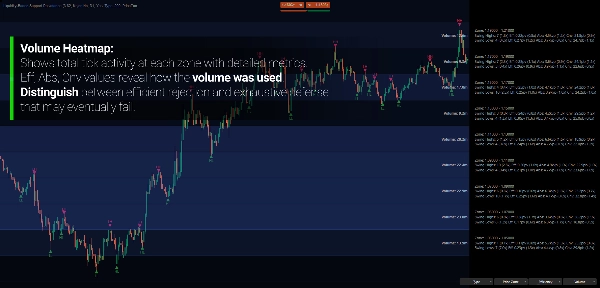
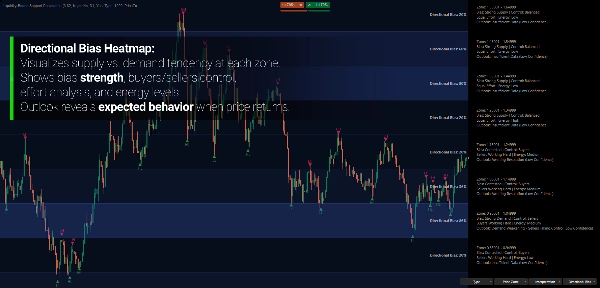
For a more visual approach, an optional heatmap provides multiple display modes.
The underlying measurements remain available rather than being hidden behind a single interpretation.
ADAPTIVE ZONE SPACING
The distance between zones adapts to the typical movement of the market.
This helps prevent the same fixed spacing from being applied to markets with very different price behavior.
The zones therefore remain related to the scale of movement being observed.
MULTI-TIMEFRAME CONTEXT
Support and resistance can be calculated from a higher timeframe and displayed on the current chart.
For example, higher-timeframe swing zones can provide broader context while a lower timeframe shows how price is interacting with those zones in greater detail.
TWO WAYS TO SEE THE ZONE
Price Level
Focus on the specific price reference.
Useful when you want a cleaner view of where the zone is located.
Price Zone
Focus on the broader area of interaction around that reference.
Useful when you want to observe the spatial range of historical reactions.
INTERPRETATION WITHOUT HIDING THE DATA
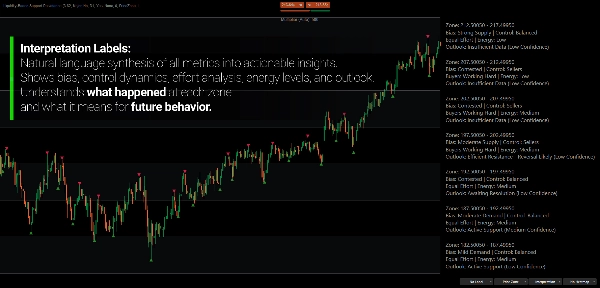
An optional plain-language interpretation can summarize the measurements into a more readable description.
This does not replace the underlying data.
You can always examine the measurements yourself and decide how they fit into the broader price geometry.
OPTIONAL SETUP MODE
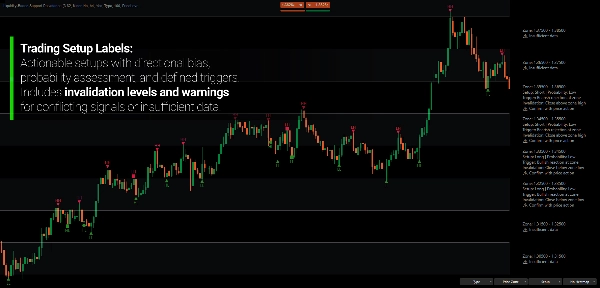
For traders who want to go one step further, an optional Setup Mode can organize the observed context into a defined trade scenario.
It can include:
- Directional bias
- Entry trigger
- Invalidation
- Probability assessment
- Conflict warnings
These are analytical interpretations of the available data, not guarantees of future outcomes.
THE LIQUIDITY MODEL
The indicator models liquidity-related behavior through the interaction between price and tick activity.
It does not access centralized order-book liquidity or real exchange volume.
For forex and other markets where broker-provided volume is used, the volume component is based on tick volume from the broker feed.
This distinction matters.
The indicator is measuring observable price and activity relationships, not claiming to reveal the actual order book.
BUILT FOR PRICE-REACTION ANALYSIS
Use the indicator to study:
- Historical support and resistance
- Repeated price reactions
- Supply and demand context
- Zone strength characteristics
- Activity around important price areas
- Efficiency and absorption
- Multi-timeframe zones
- Potential setups
- How price behaves when revisiting historical reaction areas
It is designed to give you more information about a level without forcing that information into a predetermined conclusion.
KEY FEATURES
- Adaptive swing detection
- Automatic support/resistance zones
- Psychological price mapping
- Adaptive zone spacing
- Swing count
- Swing depth
- Tick activity
- Efficiency
- Absorption
- Conviction
- Supply/demand/contested classification
- Zone history
- Level testing
- Multi-timeframe analysis
- Price Level / Price Zone views
- Optional heatmap with 17 modes
- Optional plain-language interpretation
- Optional Setup Mode
- Customizable display
---
Trading involves risk. This indicator is a technical analysis tool and should be used together with appropriate risk management.
Tóm tắt
Key functionalities include adaptive swing detection with three modes (Major, Standard, Minor), automatic mapping of swing points to volatility-adjusted round number zones, and calculation of liquidity metrics: depth, volume, efficiency, absorption, and conviction. It also provides directional analysis to determine bias (supply or demand zones), control (buyers or sellers), and energy levels at each zone.
The indicator features multiple label modes for displaying price, swing counts, activity metrics, efficiency, and natural language interpretation. A heatmap visualization encodes liquidity metrics across zones for quick pattern recognition. Multi-timeframe analysis allows viewing higher timeframe swing structure on lower timeframe charts. Dual display modes show either single price levels or full price zones with adaptive spacing.
Interpretation and setup modes synthesize data into actionable insights, including bias strength, control, effort, energy, outlook, trade triggers, invalidation criteria, and probability assessments. This tool serves traders seeking contextual understanding of market structure and liquidity dynamics rather than direct trade signals.
Đánh giá của khách hàng
Thảo luận
Câu hỏi thường gặp







![Logo "[Stellar Strategies] Inside Bar with Signals"](https://cdn.ctrader.com/image/webp/1d9e8bfa-3b2c-4440-bb37-5856902008a7_30683)















Giá