Courtiers & props
Pour entreprise
00
Days
:
00
Hours
:
00
Minutes
:
00
Seconds
Polynomial Price Projection Channel
Indicateur
Version 1.0, Feb 2026
Windows, Mac
Depuis le 03/10/2024
Ventes
135
Installations gratuites
27721
Image mise en ligne de "Polynomial Price Projection Channel"Image mise en ligne de "Polynomial Price Projection Channel"Image mise en ligne de "Polynomial Price Projection Channel"


📊 Polynomial Price Projection Channel


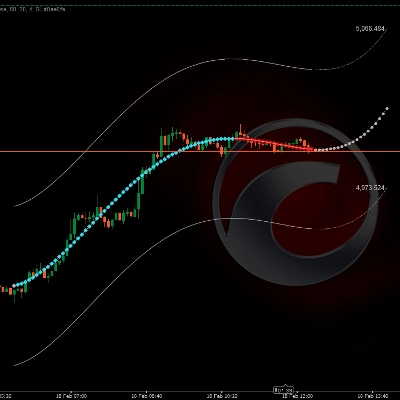
https://chartshots.spotware.com/c/699603101593d

🔎 WHAT DOES IT DO? 

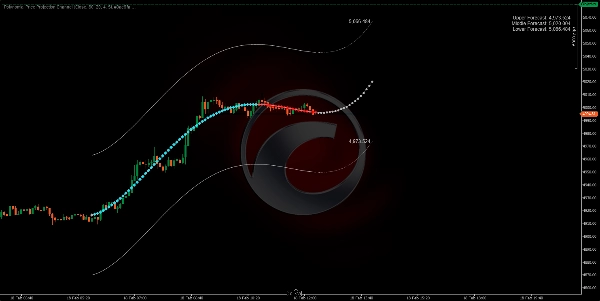
https://chartshots.spotware.com/c/69960348da652


Fits a mathematical curve over the last N price closes and extends it into the future as a projection. Around that curve it draws an upper and lower channel whose width automatically adapts to recent market volatility.

⚙️ HOW DOES THE LOGIC WORK?

  1. Takes the last N candles (Lookback Bars) and calculates the polynomial curve that best fits those prices using least squares.
  2. Extends the curve forward (Forecast Bars) as a mathematical projection of the current trend.
  3. Builds the channel by shifting the curve up and down using the maximum candle range of the analyzed period × 2.


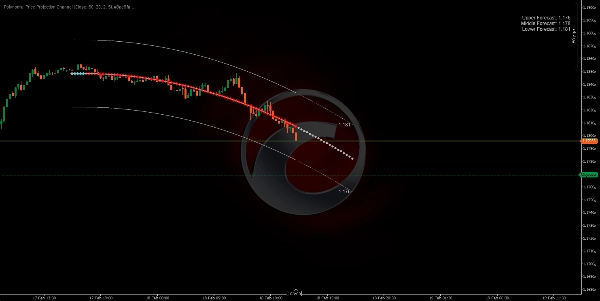
https://chartshots.spotware.com/c/6996039a07e3a

🛠️ KEY PARAMETERS

Parameter

Default

Purpose

Lookback Bars

80

How many historical candles it analyzes

Forecast Bars

20

How many candles it projects forward

Polynomial Order

4

Curve flexibility (higher = more curves)

Data Input

Close

Base price for the calculation


🎯 HOW TO USE IT?

🟢 Potential Buy → Price touches the lower band and the projection points upward.

🔴 Potential Sell → Price touches the upper band and the projection points downward.

⚠️ Always confirm with other factors before trading. This indicator is a mathematical extrapolation, not a guaranteed prediction.

0.0
Avis : 0
Avis clients
Il n'y a pas encore d'avis sur ce produit. Vous l'avez déjà essayé ? Soyez le premier à en parler aux autres !
NAS100
NZDUSD
XAUUSD
Commodities
Forex
Signal
EURUSD
Bollinger
GBPUSD
BTCUSD
AI
Indices
Prop
ATR
Stocks
Crypto
USDJPY

Plus de cet auteur

Les mieux notés
Gratuit
Indicateur
RSI
XAUUSD
Breakout
+6
ZigZag
ZigZag filters noise, spots trends, patterns, pivots, aiding analysis, trade management, and confirmations. 📉📈
Indicateur
RSI
XAUUSD
Breakout
+6
Order Block
Identify bullish and bearish Order Blocks to spot key support/resistance levels and potential trend reversals! 📈🔄
Indicateur
RSI
Breakout
XAUUSD
+5
Auto-Trend Channel
Adaptive trend channel using linear regression and Pearson correlation for dynamic support, resistance, and trends.
Indicateur
RSI
XAUUSD
Breakout
+5
BOS & CHOCH
Market structural patterns , specifically the concepts of Change of Character (ChoCH) 🔄 and Break of Structure (BoS) 💥
Indicateur
RSI
Breakout
XAUUSD
+6
Volume POC Heatmap
📊 Shows volume by price levels, highlights POC, and key zones. Identifies dynamic support/resistance and imbalances.
Indicateur
RSI
Breakout
Supertrend
All Support and Resistance Levels
"Identify key market zones and visualize support/resistance from multiple timeframes on a single chart.
Indicateur
RSI
Breakout
XAUUSD
+5
Zones Supply Demand
📊Zones Supply & Demand: Identifies key price levels with high volume concentration, marking Supply/Demand Zones & Marke
Indicateur
RSI
Breakout
XAUUSD
+5
Supertrend
💹 Define a price channel 📈 and determine trend direction (bullish 🟢 or bearish 🔴).
Indicateur
RSI
Breakout
XAUUSD
+6
Fair Value Gap Sessions
identify and highlight temporary market inefficiencies known as "fair value gaps" 🚨 within specific trading Sessions.
Indicateur
RSI
Breakout
XAUUSD
+4
Dynamic Market Structure Analysis of Turning Points
Identify market structure effortlessly with swing highs, lows, CHoCH, and BOS levels for smart trading decisions! 📊🔍"
Indicateur
Indices
RSI
XAUUSD
+7
RSI Divergence
Detects bullish and bearish divergences
Indicateur
RSI
Breakout
Supertrend
Trend Heikin Multi MA
🚀 TrendHeikinMultiMA: Advanced trend detection using Heikin-Ashi smoothing & MAs! Eliminates noise, confirms real trend

Vous pourriez aussi aimer

Indicateur
NAS100
NZDUSD
XAUUSD
+17
Liquidity Sweep FVG + MSS + HTF
Precision SMC tool with HTF sweeps, MSS confirmation & smart FVG detection for high-probability reversals.
Indicateur
NAS100
NZDUSD
Martingale
+25
Triple Momentum
The Triple Momentum indicator for cTrader is a versatile trend-following tool.
Indicateur
NAS100
NZDUSD
Martingale
+26
AbsorptionRatio_AutoRiskPanel
AbsorptionRatio_AutoRiskPanel is a single–symbol Absorption Ratio engine for cTrader that auto–calibrates its risk thres
Pips V4Final
Displays pips from daily open with high/low. Clean, customizable, perfect for quick daily price context.
Indicateur
RSI
XAUUSD
Breakout
+6
Order Block
Identify bullish and bearish Order Blocks to spot key support/resistance levels and potential trend reversals! 📈🔄
ORB_Dashboard
Trades Opening Range Breakouts Indicator with dynamic stops/targets adapting to market volatility.
Indicateur
RSI
Breakout
Supertrend
+1
Reactive Moving Average
Combines SMA with dynamic correlation to adapt to market trends. Adjusts sensitivity, filters noise🚀📉
Indicateur
NAS100
Indices
NZDUSD
+9
Smart SR Levels
Automate your price action analysis with stable, time-anchored Support & Resistance zones that adapt to breakouts in rea
IR Slowing Moving
Add Slowing to IR Moving Average.
Momentum Trend Analyzer
Provides comprehensive trend and momentum analysis by combining EMAs, RoC, normalized ATR, RSI, and volume..
Indicateur
RSI
Breakout
XAUUSD
+4
SmartTrend Support & Resistance Lines
🚀 Auto-detects support/resistance & trend channels! Saves time ⏳, spots key levels 🔍
Indicateur
Stocks
Forex
Crypto
PinBarCandlestickPattern
PinBarCandlestickPattern Indicator