Beschreibung
SC Market Structure
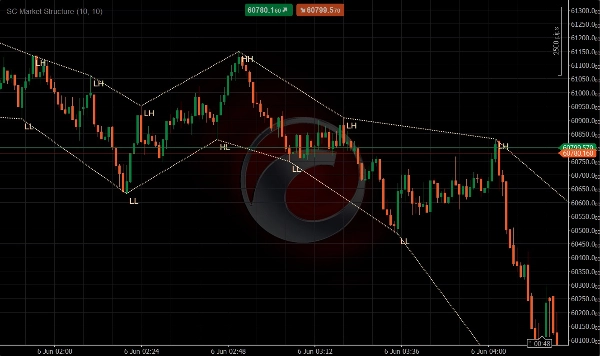
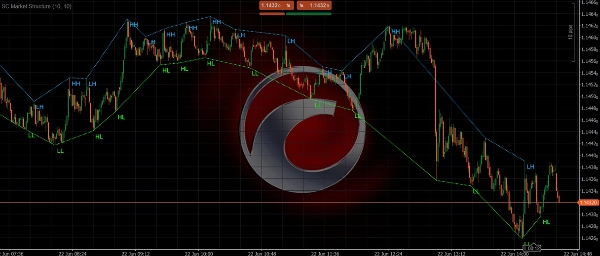
SC Market Structure ist ein visueller Marktstruktur-Indikator, der entwickelt wurde, um automatisch die wichtigsten Swing-Hochs und Swing-Tiefs direkt im Chart zu identifizieren und anzuzeigen.
Der Indikator analysiert kontinuierlich die Kursbewegungen und bildet die Entwicklung der Marktstruktur ab, indem er bedeutende Hochs und Tiefs mit dynamischen Struktur-Linien verbindet. Dies ermöglicht es Tradern, die Trendrichtung, Trendfortsetzung und potenzielle Umkehrpunkte sofort zu erkennen, ohne die Marktschwünge manuell markieren zu müssen.
Darüber hinaus klassifiziert SC Market Structure automatisch jeden neuen Strukturpunkt anhand der standardmäßigen Marktstruktur-Definitionen:
- HH (Higher High)
- HL (Higher Low)
- LH (Lower High)
- LL (Lower Low)
Durch die Kombination der automatischen Swing-Erkennung mit der Echtzeit-Markstruktur-Kennzeichnung können Trader schnell verstehen, ob sich der Markt in einem Trend befindet, konsolidiert oder Anzeichen einer möglichen Trendwende zeigt.
Hauptmerkmale
• Automatische Erkennung signifikanter Swing-Hochs und Swing-Tiefs
• Dynamische Struktur-Linien, die Markt-Pivots verbinden
• Automatische Identifikation von Higher Highs (HH)
• Automatische Identifikation von Higher Lows (HL)
• Automatische Identifikation von Lower Highs (LH)
• Automatische Identifikation von Lower Lows (LL)
• Klare Visualisierung der bullischen und bärischen Marktstruktur
• Sofortige Erkennung von Trendfortsetzungs- und Umkehrmustern
• Funktioniert auf allen Märkten und Zeitrahmen
• Saubere und intuitive Chart-Darstellung
Marktstruktur-Visualisierung
SC Market Structure bewertet kontinuierlich Kurs-Schwünge und kennzeichnet jeden neu bestätigten Strukturpunkt.
Bullische Struktur
Eine bullische Marktstruktur wird identifiziert, wenn der Kurs folgende Punkte bildet:
• Higher Highs (HH)
• Higher Lows (HL)
Diese Abfolge zeigt an, dass die Käufer die Kontrolle behalten und der Aufwärtstrend weiterhin intakt ist.
Bärische Struktur
Eine bärische Marktstruktur wird identifiziert, wenn der Kurs folgende Punkte bildet:
• Lower Highs (LH)
• Lower Lows (LL)
Diese Abfolge zeigt an, dass die Verkäufer die Kontrolle behalten und der Abwärtstrend weiterhin intakt ist.
Der Indikator verbindet diese Strukturpunkte visuell mit dynamischen Trendlinien, sodass Trader die Entwicklung der Kursstruktur in Echtzeit verfolgen können.
Warum SC Market Structure verwenden
Das Verständnis der Marktstruktur ist einer der wichtigsten Aspekte des Price Action Tradings.
Viele Trader zeichnen Swing-Hochs, Swing-Tiefs und Trendstrukturen manuell, was zeitaufwändig und subjektiv sein kann.
SC Market Structure automatisiert diesen Prozess, indem es strukturelle Wendepunkte objektiv identifiziert und sie gemäß professionellen Marktstruktur-Prinzipien kennzeichnet.
Dies ermöglicht Tradern:
• Die Trendrichtung schneller zu erkennen
• Potenzielle Umkehrungen früher zu identifizieren
• Trendfortsetzungs-Setups zu bestätigen
• Ein- und Ausstiegszeitpunkte zu verbessern
• Einen saubereren und besser organisierten Chart zu pflegen
Perfekt für
• Price Action Trader
• Scalper
• Day Trader
• Swing Trader
• Trendfolgende Trader
• Marktstruktur-Trader
• Smart Money Concept (SMC) Trader
• Trader, die eine objektive Strukturanalyse suchen
Wichtiger Hinweis
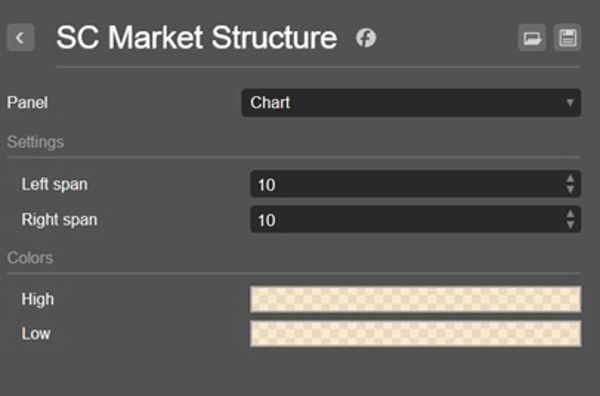
SC Market Structure identifiziert die Marktstruktur basierend auf bestätigten Swing-Hochs und Swing-Tiefs. Labels und Struktur-Linien werden erst generiert, nachdem ein Pivot durch die ausgewählten Berechnungseinstellungen validiert wurde.
Die Anpassung der Sensitivitätseinstellungen beeinflusst, wie häufig neue Strukturpunkte identifiziert und angezeigt werden.
Im Gegensatz zu traditionellen MACD-Indikatoren basiert sein visuelles Konzept darauf, Momentum-Informationen in die Price Action Analyse zu integrieren. Aus diesem Grund wird die Verwendung des Indikators in einem separaten Panel nicht empfohlen und bietet nicht die beabsichtigte Benutzererfahrung.
Lies den Trend. Folge der Struktur. Handle mit Vertrauen.
Zusammenfassung
By continuously analyzing price action, SC Market Structure helps traders quickly determine trend direction, recognize trend continuation, and spot potential reversal points without manual chart annotations. It supports all markets and timeframes, providing a clean and intuitive chart presentation.
This tool is suited for price action traders, scalpers, day traders, swing traders, trend followers, and those using Smart Money Concepts or seeking objective market structure analysis. Sensitivity settings allow customization of pivot detection frequency. The indicator integrates momentum information into price action analysis and is designed for direct chart overlay rather than separate panels.
Kundenbewertungen
5 | 100 % | |
4 | 0 % | |
3 | 0 % | |
2 | 0 % | |
1 | 0 % |