


Deskripsi
Apex Break PRO menggambar garis tren yang penting dan mencatat setiap terobosan dari garis tersebut.
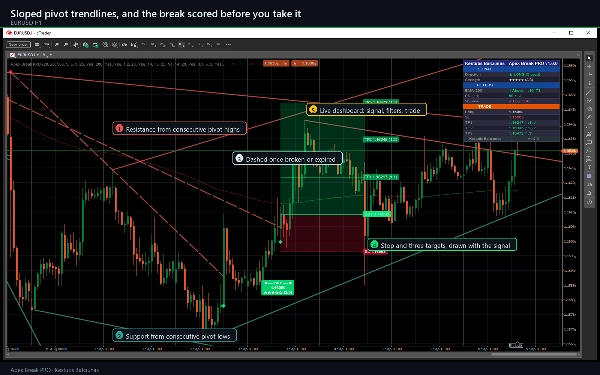
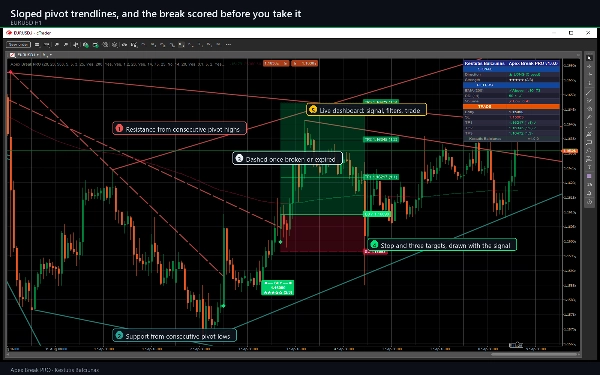
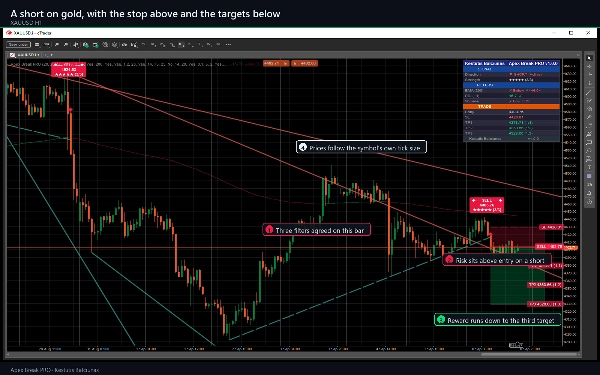
Puncak pivot berturut-turut membentuk garis resistensi miring, dasar pivot berturut-turut membentuk garis dukungan miring. Ini bukan level horizontal: mereka mengikuti arah pasar sendiri dan kedaluwarsa. Sinyal muncul ketika penutupan bar TERKONFIRMASI melewati salah satu garis tersebut dengan margin yang diukur dalam ATR, dan hanya ketika cukup banyak filter independen setuju.
Apa yang digambarnya pada grafik Anda
- Garis tren resistensi dan dukungan miring, hingga lima dari masing-masing, solid selama masih aktif dan putus-putus setelah terputus atau telah mencapai ekstensi maksimalnya.
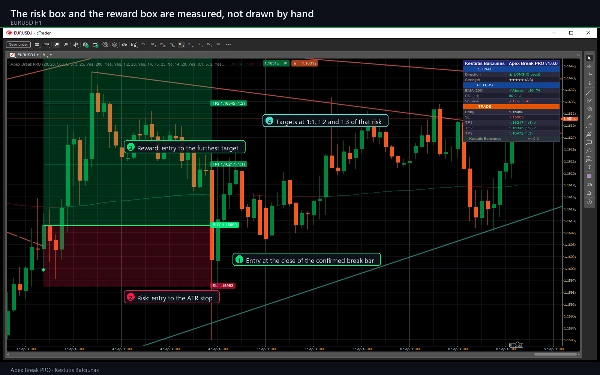
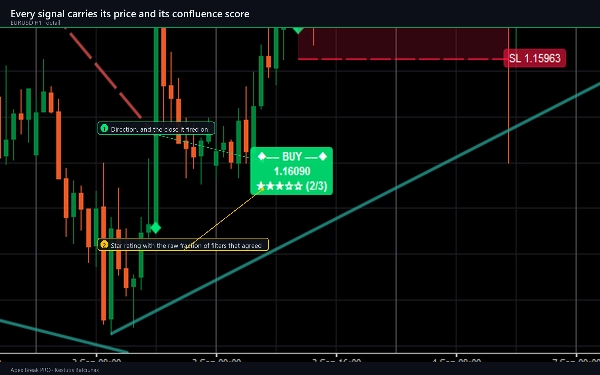
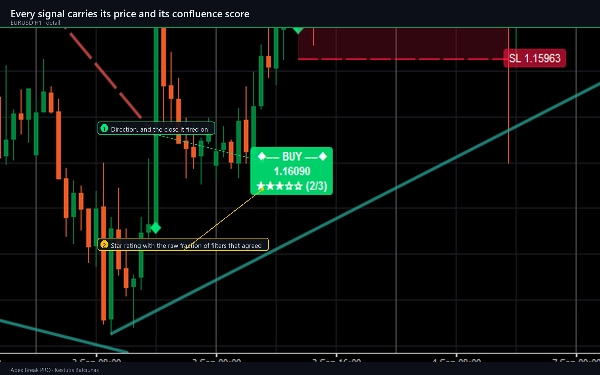
- Penanda BELI atau JUAL dengan label yang memuat harga, peringkat bintang lima dan fraksi konfluensi, misalnya 3/4.
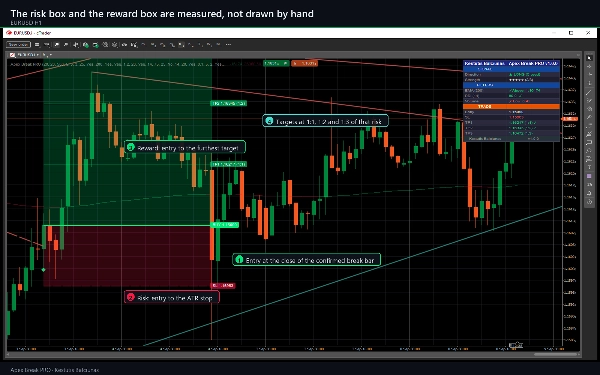
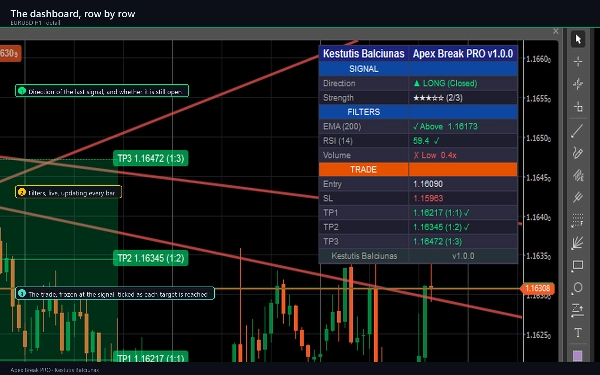
- Stop, secara default pada 1,5 x ATR, dan tiga target pada rasio 1:1, 1:2, dan 1:3 dari jarak tersebut, dengan zona risiko yang diarsir dan zona imbal hasil yang diarsir.
- EMA 200, diberi warna berdasarkan sisi mana harga diperdagangkan.
- Dashboard dua kolom dengan bagian SINYAL, bagian FILTERS yang aktif, dan bagian TRADE yang menandai setiap target saat tercapai.
Cara berdagang dengannya
- Berikan riwayat. Pada pengaturan default, dibutuhkan sekitar 250 bar sebelum garis pertama muncul, karena EMA 200 harus mulai dan pivot hanya dikonfirmasi 20 bar setelah terbentuk.
- Tunggu penanda. Terobosan dievaluasi pada bar yang sudah tertutup, jadi penanda tidak bergerak setelah dicetak.
- Baca peringkat bintang dan baris FILTERS sebelum bertindak. Skor menunjukkan berapa banyak kondisi yang diaktifkan setuju pada bar tersebut. Ini adalah deskripsi kesepakatan, bukan probabilitas.
- Gunakan stop dan target yang digambar apa adanya, atau sebagai template untuk ukuran Anda sendiri.
- Perhatikan baris TRADE. Setiap target ditandai saat harga mencapainya, dan pelacakan berhenti pada stop atau target ketiga.
- Nyalakan peringatan yang Anda inginkan. Tersedia sembilan peristiwa terpisah.
Pengaturan utama
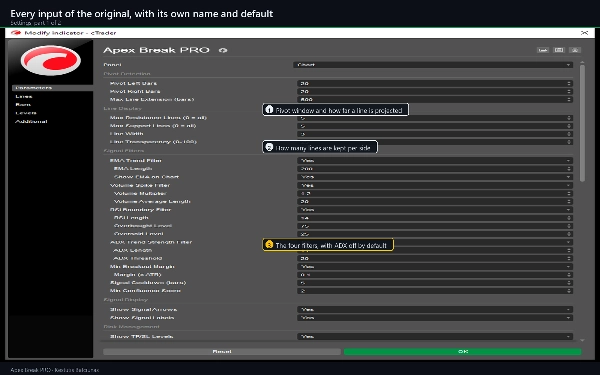
- Deteksi Pivot: bar kiri dan kanan, keduanya 20, dan ekstensi garis maksimum 500 bar.
- Tampilan Garis: hingga 5 garis resistensi dan 5 garis dukungan, lebar 3, transparansi 25.
- Filter Sinyal: EMA 200; RSI 14 dengan batas 75 dan 25; volume 1.2x rata-rata 20 bar-nya; ADX 14 di atas 20, mati secara default; margin breakout 0,1 x ATR; cooldown 5 bar; skor minimum 2.
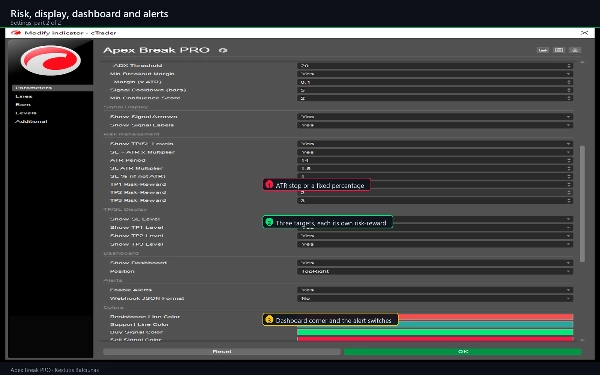
- Manajemen Risiko: ATR 14, stop pada 1,5 x ATR atau persentase tetap, target pada 1:1, 1:2 dan 1:3.
- Dashboard di enam posisi, sembilan toggle peringatan, dan empat warna garis dan sinyal.
Total 65 parameter, meliputi deteksi pivot, tampilan garis, filter sinyal, manajemen risiko, tampilan TP/SL, dashboard, sembilan toggle peringatan dengan saluran pengirimannya, dan warna-warna.
Jenis indikator, periode, instrumen, kasus penggunaan
Indikator dukungan dan resistensi, tren dan volatilitas yang menggambar pada grafik utama dan mengeluarkan sinyal. Berjalan pada simbol dan timeframe apa saja. M15, H1, dan H4 adalah jendela yang menjadi dasar desainnya; periode lebih rendah memberikan lebih banyak sinyal dengan stop ATR yang lebih ketat, D1 dan di atasnya memberikan lebih sedikit dan lebih lebar. Filter volume digunakan jika broker Anda menyediakan volume dan dapat dimatikan jika tidak. Penggunaan tipikal: entri terobosan garis tren dengan konfluensi yang dinyatakan, penempatan stop berbasis ATR, keluar bertahap pada 1:1, 1:2, dan 1:3, konfirmasi timeframe lebih tinggi, dan memberi sinyal tersembunyi ke cBot.
Untuk siapa ini
Trader yang sudah menggambar garis tren secara manual dan ingin digambar dengan cara yang sama di setiap grafik, setiap saat, dengan terobosan yang dinilai sebelum mereka bertindak. Ini adalah alat analisis: tidak pernah menempatkan, memodifikasi, atau menutup order, dan tidak memiliki akses ke akun Anda.
Versi percobaan: apa yang ditambahkan versi penuh
Versi percobaan adalah build yang sama ini, terbatas pada EURUSD, tanpa batas waktu dan semua parameter tersedia. Pada simbol lain, menampilkan pemberitahuan alih-alih menggambar. Versi penuh menghapus kunci simbol: semua pasangan forex, indeks, logam, energi, dan simbol kripto yang ditawarkan broker Anda.
Catatan teknis dan keterbatasan
- Sinyal dievaluasi pada bar yang sudah tertutup dan tidak dicat ulang. Pivot dikonfirmasi hanya setelah Pivot Right Bars terbentuk, dan keterlambatan konfirmasi itu adalah harga untuk tidak mencat ulang. Garis tren itu sendiri bersifat sementara pada bar yang masih terbentuk.
- Peringatan hanya aktif untuk bar yang ditutup setelah Anda memasang indikator, tidak untuk riwayat.
- Tanda pada baris target mencatat bahwa harga kemudian menyentuh level yang digambar pada riwayat di grafik Anda. Ini bukan hasil perdagangan: tidak ada spread, komisi, swap, slippage, atau pengisian yang terlibat, dan tidak ada statistik yang dihasilkan darinya.
- Grafik menyimpan label sinyal dan garis tren terbaru dan memangkas yang paling lama.
- Dua broker tidak memiliki candle yang identik, jadi sinyal pada grafik langsung akan berbeda dari indikator yang sama pada feed lain. Itu adalah perbedaan data, bukan perbedaan dalam perhitungan.
- Persyaratan: cTrader 5.0 atau lebih baru, diuji pada 5.9. Hak Akses: Tidak ada - tidak ada akses file, jaringan, atau perdagangan.
Dukungan
Pertanyaan melalui tab Diskusi di halaman ini atau Tanyakan penjual. Pembaruan gratis dan tercantum dalam riwayat versi. Toko menyediakan periode pengembalian uang 14 hari. Jika indikator bekerja untuk Anda, penilaian membantu trader lain menemukannya.
Perdagangan melibatkan risiko. Kinerja masa lalu tidak menjamin hasil di masa depan.
Ringkasan
Key features include visual BUY/SELL markers with price labels, star ratings indicating filter confluence, ATR-based stops (default 1.5x ATR), and three profit targets at 1:1, 1:2, and 1:3 risk-reward ratios. It also displays a 200 EMA colored by price position, shaded risk and reward zones, and a two-column dashboard showing live signals, filters, and trade progress.
Signals are generated on confirmed closed bars without repainting, and alerts can be configured for nine different events. The indicator supports volume filtering where available and includes 65 customizable parameters covering pivot detection, line display, filters, risk management, and alerts. Apex Break PRO is intended for traders who manually draw trendlines and seek consistent, scored breakout signals for analysis and trade planning. It does not execute trades or access accounts.





























