
Descrizione
Inversione a 3 barre
📊 COS'È?
L'Inversione a 3 barre è un indicatore tecnico che identifica specifici schemi di inversione formati da esattamente tre candele consecutive. Questo schema classico segnala potenziali cambiamenti nella direzione del prezzo attraverso una struttura visiva chiara: una candela di tendenza, una candela di esaurimento e una candela di inversione.
🎯 A COSA SERVE?
Questo indicatore aiuta i trader a:
- Rilevare inversioni rialziste e ribassiste con struttura a 3 candele
- Filtrare i falsi segnali tramite conferma della tendenza configurabile
- Identificare zone di supporto e resistenza basate su schemi confermati
- Visualizzare opportunità di trading con marcatori intuitivi sul grafico
- Operare inversioni ad alta probabilità su qualsiasi timeframe
🔍 COME FUNZIONA?
Schema rialzista (Inversione rialzista a 3 barre)
Struttura a tre candele:
- Candela 1 (Ribassista): Chiusura sotto l'apertura - conferma pressione di vendita
- Candela 2 (Esaurimento ribassista): Fa nuovi minimi E nuovi massimi sotto la candela 1, con chiusura ribassista - segnale di capitolazione ⚠️
- Candela 3 (Inversione rialzista): Chiusura sopra l'apertura E massimo sopra il massimo della candela 1 - conferma il cambio di controllo ✅
Schema ribassista (Inversione ribassista a 3 barre)
Struttura opposta:
- Candela 1 (Rialzista): Chiusura sopra l'apertura - conferma pressione di acquisto
- Candela 2 (Estensione rialzista): Fa nuovi massimi E nuovi minimi sopra la candela 1, con chiusura rialzista - segnale di sovraestensione ⚠️
- Candela 3 (Inversione ribassista): Chiusura sotto l'apertura E minimo sotto il minimo della candela 1 - conferma il cambio di controllo ✅
Sistema di gestione visiva (Macchina a stati)
L'indicatore elabora ogni schema in tre fasi sequenziali:
FASE 1 - RILEVAMENTO DELLO SCHEMA: 🔍
- La struttura completa a 3 candele viene identificata
- Un indicatore a triangolo (▲ rialzista / ▼ ribassista) appare sulla terza candela
- Un rettangolo semi-trasparente di configurazione viene disegnato coprendo:
-
- Rialzista: Dal massimo della candela 1 al minimo più basso (candela 2 o 3)
- Ribassista: Dal minimo della candela 1 al massimo più alto (candela 2 o 3)
- Questo rettangolo segna la "zona di battaglia" dove è avvenuta l'inversione
FASE 2 - CONFERMA O INVALIDAZIONE: ⏳
Il sistema attende la candela successiva allo schema per convalidarlo:
Conferma rialzista: ✅
- La chiusura della candela successiva deve superare il massimo della candela 1 (soffitto del rettangolo)
- Un punto solido (●) appare segnando la conferma
- Il rettangolo diventa una zona di supporto attiva
Conferma ribassista: ✅
- La chiusura della candela successiva deve rompere il minimo della candela 1 (pavimento del rettangolo)
- Un punto solido (●) appare segnando la conferma
- Il rettangolo diventa una zona di resistenza attiva
Invalidazione: ❌
- Il rialzista fallisce se: chiusura sotto il minimo del rettangolo OPPURE appare uno schema ribassista
- Il ribassista fallisce se: chiusura sopra il massimo del rettangolo OPPURE appare uno schema rialzista
- Il rettangolo smette di estendersi (lo schema muore)
Estensione in attesa: ⏸️
- Se non c'è conferma o fallimento, il rettangolo si estende orizzontalmente candela dopo candela
FASE 3 - ZONA DI SUPPORTO/RESISTENZA ATTIVA: 🎯
- Una volta confermata, la zona si estende indefinitamente verso destra
- Zona rialzista: Rimane attiva finché il prezzo resta sopra il pavimento
- Zona ribassista: Rimane attiva finché il prezzo resta sotto il soffitto
- La zona si disattiva quando il prezzo la rompe completamente nella direzione opposta
⚙️ CONFIGURAZIONE PRINCIPALE
Modalità schema
Controlla quali variazioni dello schema sono accettate:
- Normale: Accetta solo quando la candela 3 chiude DENTRO il range della candela 1
-
- Rialzista: Chiusura < massimo della candela 1 (inversione moderata)
- Ribassista: Chiusura > minimo della candela 1 (inversione moderata)
- Avanzata: Accetta solo quando la candela 3 chiude FUORI dal range della candela 1 🔥
-
- Rialzista: Chiusura > massimo della candela 1 (inversione esplosiva)
- Ribassista: Chiusura < minimo della candela 1 (inversione esplosiva)
- Tutti (Consigliato): Accetta entrambi i tipi senza distinzione ⭐
Tipo di Supporto/Resistenza
- Livello: Funzionalità base della linea (limitata in questa versione)
- Zona: Disegna rettangoli ombreggiati che segnano le zone SR dopo conferma 📦
- Nessuno: Nessuna zona SR, mostra solo gli schemi rilevati
Colori personalizzabili 🎨
- Colore inversione rialzista: Per triangoli, rettangoli e zone rialziste (default:
#2962FF- blu) - Colore inversione ribassista: Per triangoli, rettangoli e zone ribassiste (default:
#FF9800- arancione) - Colore tendenza rialzista: Per visualizzazione filtro tendenza (default:
#089981- verde) - Colore tendenza ribassista: Per visualizzazione filtro tendenza (default:
#F23645- rosso)
🔧 FILTRI DI TENDENZA
L'indicatore può filtrare gli schemi basandosi sulla direzione generale della tendenza utilizzando quattro metodi:
1. Nuvola di medie mobili ☁️
Utilizza due medie mobili per identificare la tendenza:
Parametri:
- Tipo di media mobile: Semplice, Esponenziale, Hull, Ponderata, ecc. (default: Hull)
- Periodo veloce: 50 (default)
- Periodo lento: 200 (default)
Logica del filtro (Allineata):
- Tendenza rialzista rilevata quando: Prezzo > MA veloce E MA veloce > MA lenta ✅
- Tendenza ribassista rilevata quando: Prezzo < MA veloce E MA veloce < MA lenta ✅
- Mostra solo schemi rialzisti in tendenza rialzista e schemi ribassisti in tendenza ribassista
Logica opposta (Opposto):
- Inverte le condizioni per catturare inversioni contro-tendenza maggiori
2. Supertrend 📈
Indicatore di trend basato sulla volatilità (ATR):
Parametri:
- Periodo ATR: 10 (default) - finestra di calcolo della volatilità
- Fattore moltiplicatore: 3.0 (default) - sensibilità dell'indicatore
Logica:
- Calcola banda superiore e inferiore usando ATR
- Prezzo sopra Supertrend = tendenza rialzista 🟢
- Prezzo sotto Supertrend = tendenza ribassista 🔴
- Filtra gli schemi secondo l'allineamento configurato
3. Canali Donchian 📊
Utilizza estremi di prezzo su un periodo:
Parametri:
- Lunghezza canale: 13 (default)
Logica:
- Canale superiore = massimo più alto degli ultimi N periodi
- Canale inferiore = minimo più basso degli ultimi N periodi
- Punto medio = (superiore + inferiore) / 2
- Prezzo sopra il punto medio = tendenza rialzista 🟢
- Prezzo sotto il punto medio = tendenza ribassista 🔴
4. Nessuno (Nessun filtro) 🔓
Mostra TUTTI gli schemi a 3 barre rilevati senza considerare la tendenza generale. Utile per:
- Mercati laterali
- Analisi pura degli schemi
- Trading di inversione in qualsiasi contesto
Allineamento della tendenza
Si applica quando il filtro è attivo:
- Allineato: Mostra solo schemi che vanno CON la tendenza identificata ➡️
-
- Solo schemi rialzisti in tendenza rialzista
- Solo schemi ribassisti in tendenza ribassista
- Opposto: Mostra solo schemi che vanno CONTRO la tendenza identificata 🔄
-
- Schemi rialzisti in tendenza ribassista (inversione maggiore)
- Schemi ribassisti in tendenza rialzista (inversione maggiore)
Riepilogo
It operates in three phases: pattern detection, confirmation or invalidation based on the next candle's behavior, and establishing active support or resistance zones that extend while price respects them. The indicator supports configurable pattern modes (Normal, Enhanced, or All) to control acceptance criteria for reversals.
Trend filtering is available through four methods—Moving Average Cloud, Supertrend, Donchian Channels, or no filter—allowing users to align pattern signals with overall market trends or capture counter-trend reversals. Confirmed reversal zones are displayed as shaded rectangles or levels, customizable in color for bullish and bearish signals, trend filters, and zones.
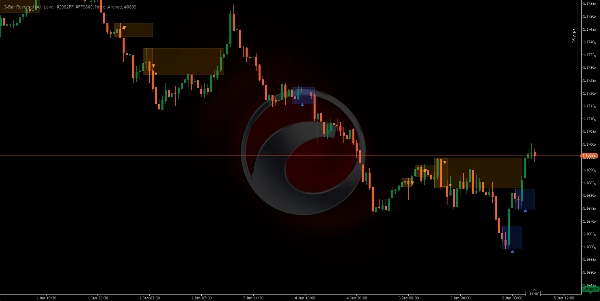
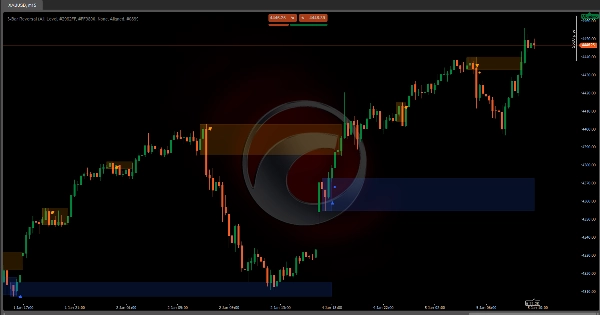
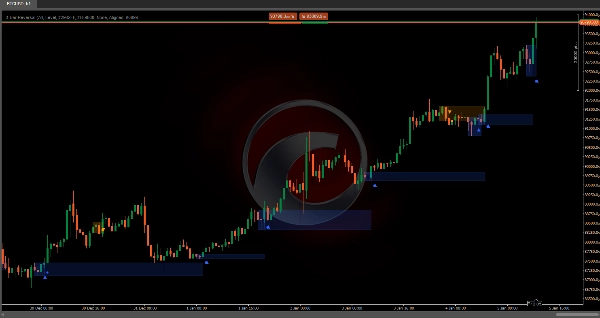
This tool is designed for use on any timeframe and across various markets, including forex pairs (EURUSD, GBPUSD, USDJPY, NZDUSD), commodities (XAUUSD), indices (NAS100), and cryptocurrencies (BTCUSD). It aids traders in detecting high-probability reversals, filtering false signals, and identifying support and resistance zones with clear visual markers.


![Logo di "[Hamster-Coder] Bollinger Bands"](https://cdn.ctrader.com/image/webp/21d8e5d6-fb11-4bac-b9ee-cd05c2b76804_30327)
