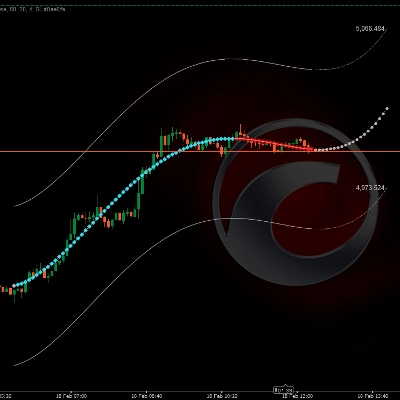
📊 Polinom Fiyat Projeksiyon Kanalı
https://chartshots.spotware.com/c/699603101593d
🔎 NE YAPAR?
https://chartshots.spotware.com/c/69960348da652
Son N fiyat kapanışlarına bir matematiksel eğri uyarlar ve geleceğe doğru projekte eder. Bu eğrinin etrafında, genişliği son piyasa volatilitesine otomatik olarak uyum sağlayan bir üst ve alt kanal çizer.
⚙️ LOGİK NASIL ÇALIŞIR?
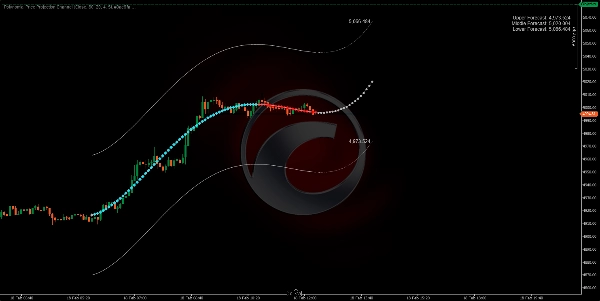
- Son N mum çubuğunu alır (Lookback Bars) ve en iyi uyan polinom eğrisini en küçük kareler yöntemiyle hesaplar.
- Eğriyi ileriye uzatır (Forecast Bars) mevcut trendin matematiksel bir projeksiyonu olarak.
- Kanalı oluşturur, eğriyi analiz edilen dönemin maksimum mum aralığı × 2 kadar yukarı ve aşağı kaydırarak.
https://chartshots.spotware.com/c/6996039a07e3a
🛠️ TEMEL PARAMETRELER
Parametre
Varsayılan
Amaç
Lookback Bars
80
Kaç tane geçmiş mum analiz edilir
Forecast Bars
20
Kaç mum ileriye projekte edilir
Polynomial Order
4
Eğri esnekliği (yüksek = daha fazla eğri)
Data Input
Close
Hesaplama için temel fiyat
🎯 NASIL KULLANILIR?
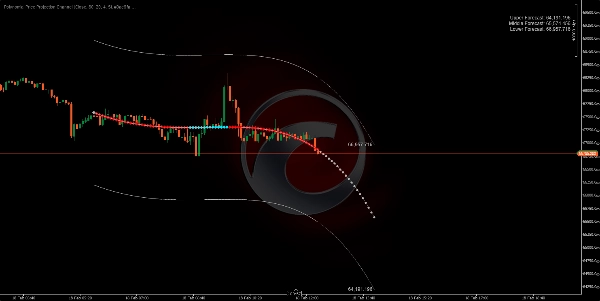
🟢 Olası Alım → Fiyat alt banda dokunur ve projeksiyon yukarı yönlüdür.
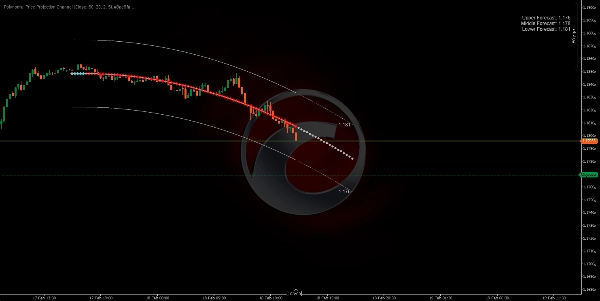
🔴 Olası Satım → Fiyat üst banda dokunur ve projeksiyon aşağı yönlüdür.
⚠️ Her zaman diğer faktörlerle doğrulayın. Bu gösterge matematiksel bir ekstrapolasyondur, garanti edilen bir tahmin değildir.
5 | 0 % | |
4 | 100 % | |
3 | 0 % | |
2 | 0 % | |
1 | 0 % |


