설명
📊 잭슨 존 — 적응형 피보나치 존 매핑
가격 움직임 아래의 리듬을 밝혀냅니다. 잭슨 존은 피보나치로 예측된 세션 범위, 적응형 라벨링, 견고한 시간 논리를 사용하여 일중 및 다일 구조를 매핑합니다. 기관급 명확성을 위해 설계되어 변동성 높은 시장에서 당신의 우위가 됩니다.
🔍 주요 기능
- 사용자 정의 가능한 피보나치 배율
자신만의 확장 비율을 정의하세요(기본값: 0.618, 1.000, 1.618). 전략에 맞게 존을 맞춤 설정할 수 있습니다.
- 다일 모드: 여러 세션에 걸쳐 존을 확장하여 지속적인 구조와 장기적 합류를 드러냅니다.
- 주말 논리
일요일과 월요일 세션 모두에 금요일 데이터를 자동으로 사용하여, 일요일 바가 있는 브로커에서도 신뢰할 수 있는 수준을 보장합니다.
- 시각적 유연성
- 조정 가능한 상단/하단 존 색상
- 투명 오버레이를 위한 불투명도 조절(0–255)
- 선택적 라벨로 선택한 배율을 동적으로 반영
- 오버레이 디자인
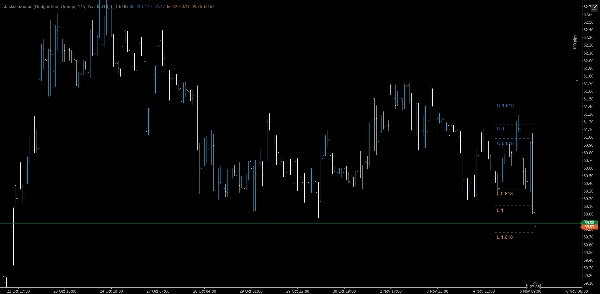
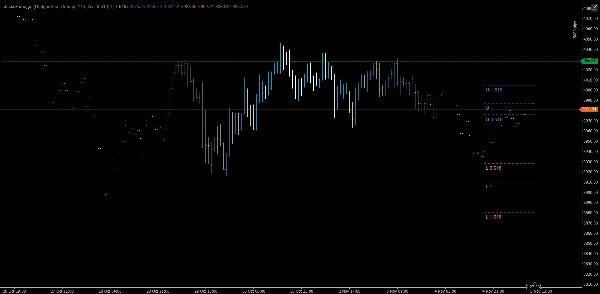
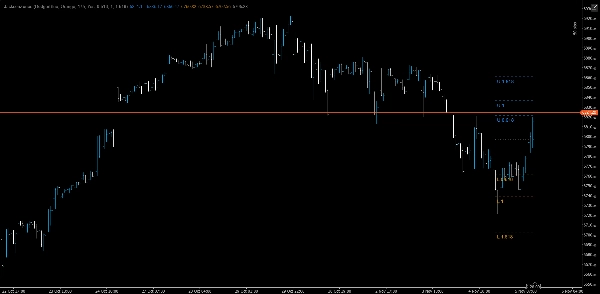
존과 피벗이 가격 차트에 직접 표시되어 즉각적인 맥락을 제공합니다.
🧠 사용 사례
• 돌파 확인: 1.000 또는 1.618 존을 통한 강한 움직임은 종종 지속 신호입니다.
• 반전 감지: 0.618 또는 1.000 존에서의 실패는 소진을 나타냅니다.
• 거래 관리: 존을 이용해 스톱 위치, 스케일링 또는 이익 목표를 설정하세요.
• 세션 고정: 존은 매일 리셋되어 변동성 변화에 적응하며 주말 간극을 존중합니다.
요약
지표 프로필
고객 리뷰
4.0
리뷰: 1
5 | 0 % | |
4 | 100 % | |
3 | 0 % | |
2 | 0 % | |
1 | 0 % |
상담
자주 묻는 질문(FAQ)
BTCUSD
Fibonacci
Forex
Indices
EURUSD
GBPUSD
Crypto
XAUUSD
NAS100
트레이딩 봇, 지표, 플러그인 등 cTrader Store에서 제공되는 상품은 제3자 개발자에 의해 제공되며, 이는 단순히 정보 및 기술적 접근을 목적으로 제공된 것입니다. cTrader Store는 중개인이 아니며, 투자 조언, 개인별 추천 또는 향후 성과에 대한 어떠한 보장도 제공하지 않습니다.


가격
26
판매
2.17K
무료 설치