설명
ATR 고급 변동성 및 추세 시스템
기본 평균 진폭 범위(ATR)는 시장 변동성을 측정하는 훌륭한 도구이지만, 기본 형태에서는 단일하고 읽기 어려운 선에 불과합니다. 변동성이 높거나 낮은지 알려주지만, 이를 어떻게 거래해야 하는지는 알려주지 않습니다.
이 ATR 고급은 이 기본 지표를 완전한 시각적 거래 시스템으로 변환합니다. 변동성 신호선, 방향성 페인트바, 모멘텀 히스토그램을 도입하여 시장이 움직이는 시기뿐만 아니라 현재 추세 뒤에 얼마나 많은 동력이 있는지 정확히 알려줍니다.
전체 버전의 주요 기능:
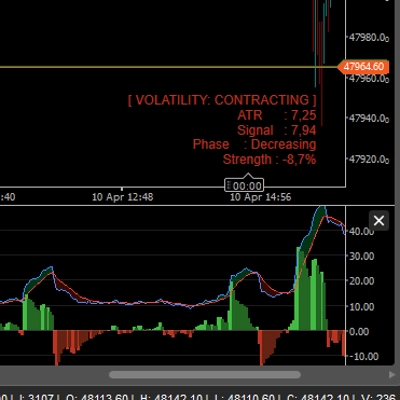
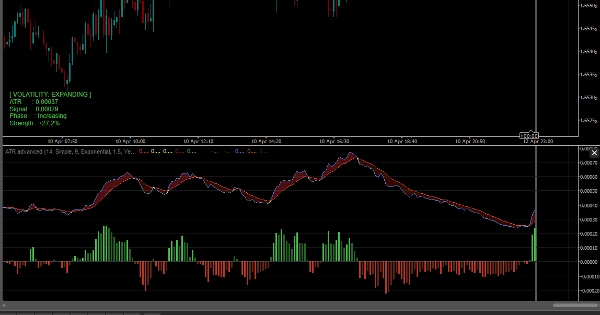
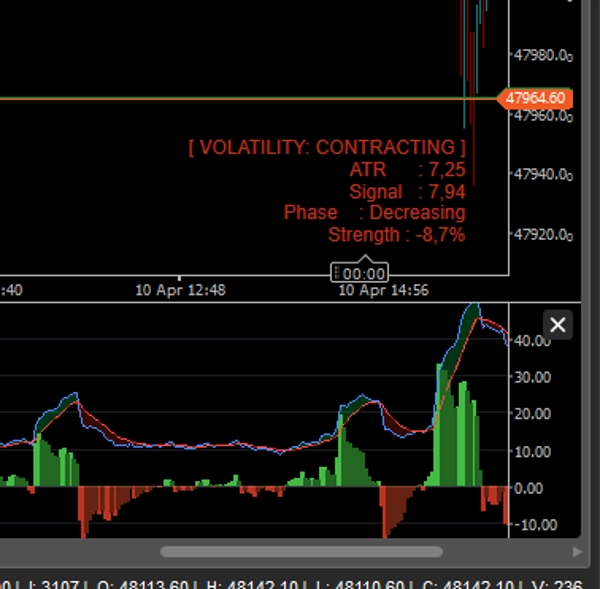
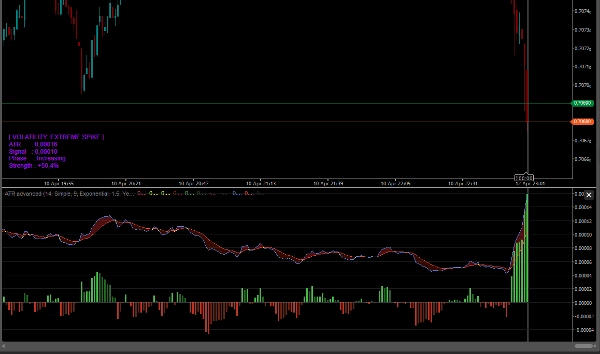
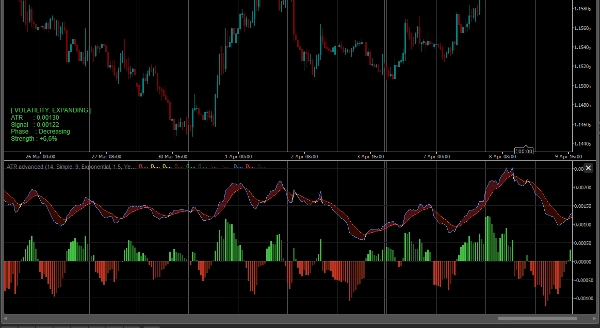
- 변동성 확장 구름: ATR에 이동 평균(신호선)을 추가했습니다. ATR과 신호선 사이의 공간은 동적인 구름으로 채워집니다.
-
- 녹색 구름(확장 중): 변동성이 증가하고 있습니다. 시장이 깨어나고 추세가 강합니다.
- 적색 구름(수축 중): 변동성이 줄어들고 있습니다. 시장이 통합되거나 횡보 중입니다.
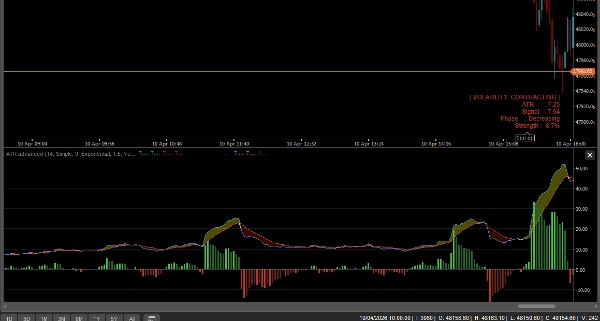
- 모멘텀 히스토그램: 하단에 위치한 맞춤형 히스토그램은 ATR과 신호선 간의 정확한 차이를 추적하여 변동성 돌파를 완전히 나타내기 전에 포착할 수 있도록 도와줍니다.
- 스마트 바 색상 지정(방향 + 변동성): 이것이 궁극적인 기능입니다. 이 지표는 가격 방향(강세/약세)과 변동성 상태를 모두 읽어 캔들을 다음과 같이 색칠합니다:
-
- 밝은 녹색/적색: 강한 추세 + 확장 중인 변동성 (돌파 및 추세 거래에 완벽함).
- 어두운 녹색/적색: 약한 추세 + 수축 중인 변동성 (경고: 모멘텀이 약해지고 있음).
- 극단적 변동성 감지: ATR이 비정상적으로 급등할 때(예: 주요 뉴스 이벤트나 급등 정점 시), 캔들은 보라색(극단적)으로 변해 잠재적 클라이맥스나 대규모 돌파를 경고합니다.
- 실시간 정보 대시보드: 세련된 차트 내 패널이 정확한 ATR 값, 변동성 단계(확장/수축), 그리고 백분율 강도 수치를 표시합니다.
- 완전한 잠금 해제: 모든 심볼(외환, 암호화폐, 지수, 주식)과 모든 시간대에서 제한 없이 거래할 수 있습니다. 평생 접근 권한.
어떻게 거래하나요?
- 돌파: 변동성 구름이 적색(수축 중)일 때는 거래를 피하세요. ATR이 신호선을 상향 돌파하고(구름이 녹색으로 변하며) 캔들이 밝은 녹색 또는 밝은 적색으로 칠해질 때까지 기다리세요. 이것이 진정한 고확률 돌파를 확인합니다.
- 추적 정지: 변동성 구름이 녹색인 동안에는 승리 중인 거래를 유지하세요. 구름이 하락하여 적색으로 변하면 모멘텀이 소진된 것이므로 이익 실현하기 좋은 시점입니다.
- 클라이맥스 경고: 추세 중에 캔들이 갑자기 보라색으로 변하면 주의하세요! 이는 극단적인 변동성 급증을 나타내며, 종종 추세가 끝나고 급격한 반전 직전에 발생합니다.
요약
지표 프로필
지표 카테고리
모멘텀
출력 유형
시각화
신호
필터
데이터 요구 사항
막대만
지원되는 신호
추세 강도
변동성
고객 리뷰
4.5
리뷰: 2
5 | 50 % | |
4 | 50 % | |
3 | 0 % | |
2 | 0 % | |
1 | 0 % |
고객 리뷰
April 18, 2026
3 percent DD is the line to watch, and the log becomes easier to read.
상담
자주 묻는 질문(FAQ)
ATR
Moving Average
트레이딩 봇, 지표, 플러그인 등 cTrader Store에서 제공되는 상품은 제3자 개발자에 의해 제공되며, 이는 단순히 정보 및 기술적 접근을 목적으로 제공된 것입니다. cTrader Store는 중개인이 아니며, 투자 조언, 개인별 추천 또는 향후 성과에 대한 어떠한 보장도 제공하지 않습니다.


!["[Stellar Strategies] Inside Bar with Signals" 로고](https://cdn.ctrader.com/image/webp/1d9e8bfa-3b2c-4440-bb37-5856902008a7_30683)


가격
24
판매
710
무료 설치