
present
Zarejestruj się i otrzymaj 50 $ zniżki na pierwszy zakup
Trading product for Clean Trade Optimization Line Pro Wskaźnik Supertrend, image 1
Clean Trade Optimization Line Pro
Wskaźnik
Wersja 1.0, Aug 2026
Windows, Mac
Trading product for Clean Trade Optimization Line Pro Wskaźnik Supertrend, image 2
Trading product for Clean Trade Optimization Line Pro Wskaźnik Supertrend, image 3
Trading product for Clean Trade Optimization Line Pro Wskaźnik Supertrend, image 4
Trading product for Clean Trade Optimization Line Pro Wskaźnik Supertrend, image 5
Od 23/07/2026

Opis

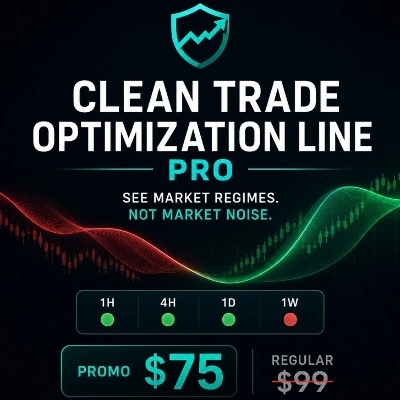
Zobacz reżimy rynkowe. Nie szum rynkowy.


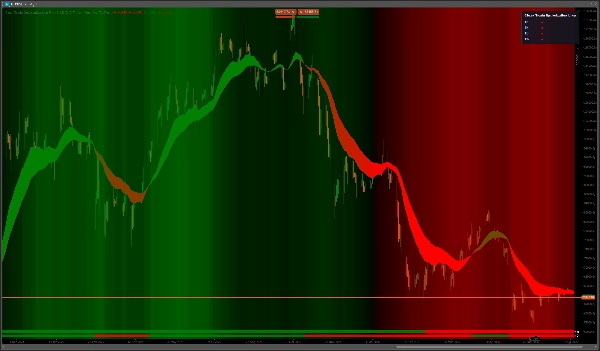
Clean Trade Optimization Line Pro przekształca złożone ruchy cenowe w czyste, premium wizualne doświadczenie stworzone do koncentracji.


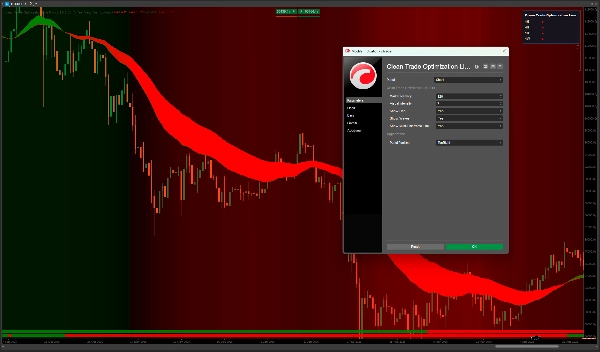
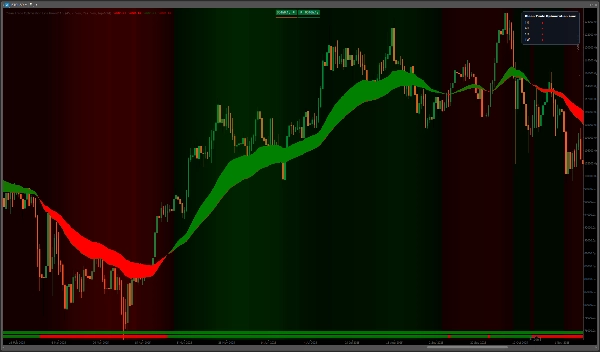
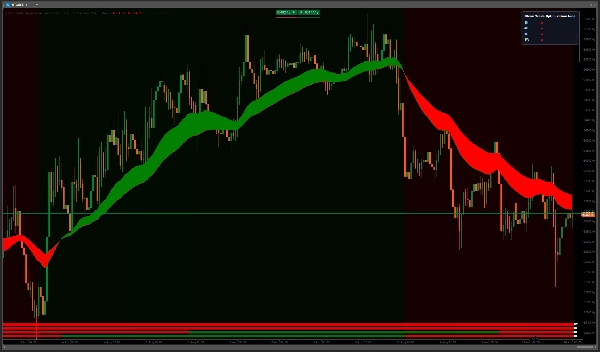
Kierunkowa wstęga sprawia, że zmiana charakteru rynku jest natychmiast widoczna. Płynne fale tła dodają szerszy kontekst bez bałaganu, podczas gdy widok wieloczasowy utrzymuje większy obraz blisko. Historyczne paski statusu są bezpośrednio wyrównane z wykresem, pomagając zobaczyć, jak kontekst rynkowy ewoluował wraz z ceną.


Interfejs pozostaje celowo prosty. Dodaj Clean Trade Optimization Line Pro do wykresu, wybierz preferowaną intensywność wizualną i skup się na tym, co ważne.


Clean Trade Optimization Line Pro działa doskonale z BTC na interwale 1D, gdzie główne przejścia rynkowe można obserwować z wyjątkową klarownością.


Najważniejsze cechy


• Premium wizualizacja wstęgi

• Płynny byczy i niedźwiedzi kontekst rynkowy

• Przegląd statusu wieloczasowego

• Historyczny kontekst wyrównany z wykresem

• Czysty, skoncentrowany interfejs

• Historyczna prezentacja bez przemalowywania

• Zaprojektowany wyłącznie jako wskaźnik cTrader


Mniej szumu. Więcej kontekstu. Lepsza koncentracja.


Clean Trade Optimization Line Pro jest wyłącznie wskaźnikiem analizy technicznej. Nie przewiduje przyszłej wydajności rynku i nie gwarantuje zysków ani sukcesu w handlu.


Handluj ostrożnie. Zarządzaj swoim ryzykiem.

Podsumowanie

Podsumowanie AI
Clean Trade Optimization Line Pro is a technical analysis indicator designed exclusively for the cTrader platform. It provides a premium visual representation of market regimes, focusing on clarity by filtering out market noise. The indicator features a directional ribbon that highlights changes in market character, smooth background waves to convey bullish and bearish context, and a multi-timeframe status overview to maintain awareness of broader market conditions. Historical status bars aligned with the price chart allow users to track how market context has evolved over time. Its interface is intentionally simple, enabling users to adjust visual intensity and focus on relevant market information. The indicator is optimized for use with Bitcoin (BTC) on the daily (1D) timeframe, where it helps identify major market transitions with enhanced clarity. It offers non-repainting historical data presentation to support reliable analysis. Key features include premium ribbon visualization, smooth market context waves, multi-timeframe overview, chart-aligned historical context, and a clean, focused interface. This product is categorized under trend indicators and supports visualization and signal outputs, including cross signals, based on bar data inputs.
Profil wskaźnika
Kategoria wskaźnika
Trend
Typ wyjścia
Sygnały
Wizualizacja
Wymagania dotyczące danych
Tylko słupki
Obsługiwane sygnały
Przecięcie

Opinie klientów

0.0
Opinie: 0
Opinie klientów
Ten produkt nie ma jeszcze opinii. Wypróbowałeś(-aś) go już? Bądź pierwszy(-a) i powiedz o tym innym!

Dyskusja

Częste pytania

Supertrend
Produkty dostępne za pośrednictwem cTrader Store, w tym boty handlowe, wskaźniki i wtyczki, dostarczane są przez deweloperów zewnętrznych i udostępniane wyłącznie w celach informacyjnych oraz w celu zapewnienia dostępu technicznego. cTrader Store nie jest brokerem i nie zapewnia doradztwa inwestycyjnego, nie udziela spersonalizowanych rekomendacji ani nie gwarantuje przyszłych wyników.

Możesz także polubić

Wskaźnik
VWAP
Forex
+12
Unlock VWAP in cTrader! Choose anchor periods, price sources, and display deviation bands with real-time tick updates.
Wskaźnik
Forex
Multi-timeframe candlesticks!
Wskaźnik
ZLSMA: Zero-lag trend indicator! Catch trends fast with customizable settings. Boost your trading precision.
Wskaźnik
Channel
Imbalance
+2
Adaptive volatility channel based on moving average and standard deviation (σ).
Wskaźnik
ADX
ATR
+1
Indicador de Sinais Visuais para Spotcrude (WTI) ou SpotBrent com filtros de tendência, operacional de 10 e 15 minutos.
Wskaźnik
RSI
MACD
This indicator is a combination of MACD and RSI into one. This is perfect fusion and powerful indicator ever.
Wskaźnik
Signal
Trades Opening Range Breakouts Indicator with dynamic stops/targets adapting to market volatility.
Wskaźnik
MACD
Forex
+2
a revolutionary indicator that integrates volume into MACD.
Wskaźnik
SMC
Prop
+15
Automatic Elliott Wave Detection with Professional Filters
Wskaźnik
RSI
Stochastic
+2
Composite mean-reversion oscillator merging Z-Score, RSI & Bollinger %B into one clear overbought/oversold signal.
Wskaźnik
ATR
RSI
+6
Market structural patterns , specifically the concepts of Change of Character (ChoCH) 🔄 and Break of Structure (BoS) 💥
Wskaźnik
Market Sessions
Wskaźnik
BOS
MSS
+3
Orderblocks with Multi-Timeframe.
Wskaźnik
ATR
Forex
+5
🚀 Buy and sell signals 📈📉 only when three independent engines agree simultaneously.
Wskaźnik
Key Levels
Spots key hourly ranges and signals breakouts using arrows & colored background zones. Ideal for Gold.
Logo „Average Cost Price”
Najwyżej oceniane
4.5
(4)
Wskaźnik
Prop
Forex
+9
Average Cost Price helps you keep track of your open positions on the chart. In doing so, it provides lines and explanat
Wskaźnik
Doji
Volume
+5
Instantly spot high-liquidity institutional moves with clean, non-obtrusive triangle alerts on cTrader charts.
Wskaźnik
RSI
RSI on the main chart with 45/55 momentum levels, overbought/oversold levels, averaged RSI, and multi-timeframe support.

Cena

Od 23/07/2026

















