"Parabolic RSI Alert" logo
Parabolic RSI Alert
"Parabolic RSI Alert" uploaded image
Since 14/07/2025
49
Sales

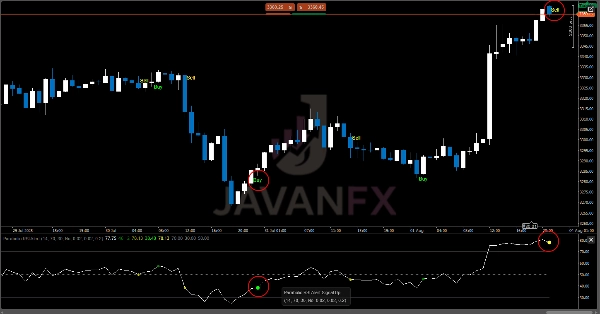
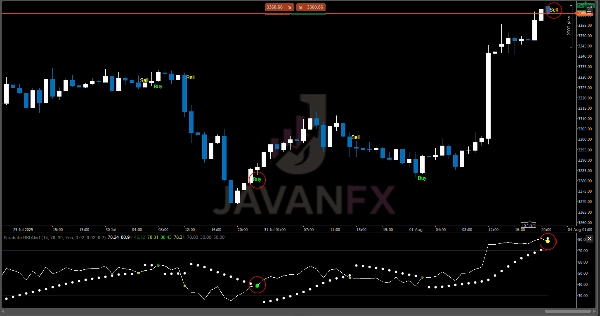
The Parabolic RSI Alert is a powerful indicator that combines the precision of Relative Strength Index (RSI) with the dynamic trend-following capabilities of a custom Parabolic SAR. This unique fusion helps traders identify high-probability reversal points with clear visual signals and real-time alerts.

Usage Notes:

  • The indicator works best on 1H+ timeframes
  • Strong signals occur when reversals happen in overbought/oversold zones
  • Regular signals appear when reversals occur outside extreme zones
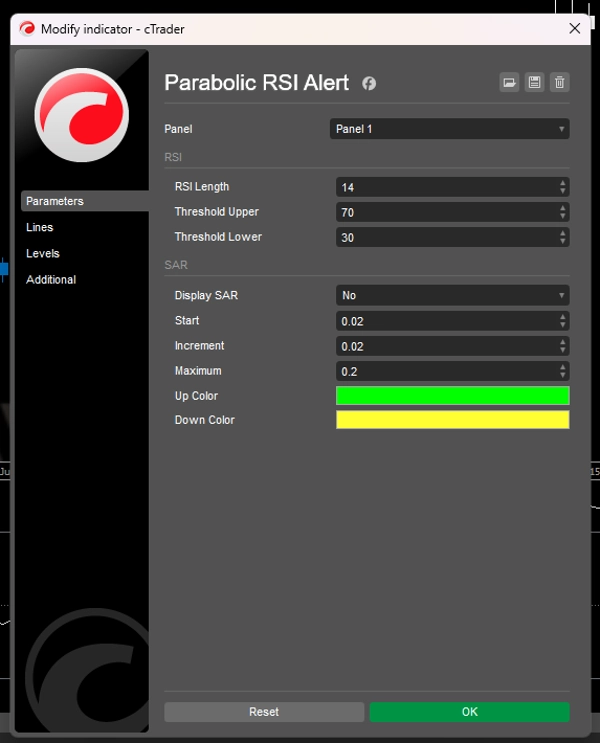
  • SAR points only plot when Display SAR is enabled
  • Combine with price action and other indicators to confirm entry and exit points(Optional).

Ideal for traders who:

  • Want to reduce lag in traditional RSI analysis
  • Need clear visual & audible alerts for timely entries
  • Prefer mechanical signals over subjective chart reading
Indicator profile
0.0
Reviews: 0
Customer reviews
No reviews for this product yet. Already tried it? Be the first to tell others!
Products available through cTrader Store, including trading bots, indicators and plugins, are provided by third-party developers and made available for informational and technical access purposes only. cTrader Store is not a broker and does not provide investment advice, personal recommendations or any guarantee of future performance.

More from this author

ZLSMA: Zero-lag trend indicator! Catch trends fast with customizable settings. Boost your trading precision.
A powerful ATR-based indicator generating clear BUY/SELL signals. Features real-time alerts and customizable sensitivity
Alpha Sentiment Pro - See the Market's Pulse Before It Moves
Laser entries with pivot confirmation. No repaint, all timeframes. Professional results.
UT Bot Alerts Nova: Advanced trend-following indicator using ATR for signals. Precise entries/exits.
Parabolic SAR Alert - Trend reversal alerts with smart signals & custom alerts.
Conquer the markets with MA Sabres! This indicator spots trend flips with MAs and cool Sabre shapes & alerts.
Spot Strong Trends Early & Filter Market Noise
Master RSI reversals with Parabolic SAR precision! Get real-time alerts for high-probability trend changes.
BB Breakout Oscillator with alerts! Spot trend reversals using Bollinger Bands. Bullish/Bearish crossovers Alerts.
Multi-asset screener with real-time RSI/volatility analysis, interactive dashboard, and color-coded trading signals.
Identifies market trends (-10 to +10) using HMA with volume confirmation. Includes customizable alerts.

You may also like

sma color
Editions: Free (core VWAP + bands) · Pro (multi‑VWAP, click‑to‑anchor, alerts).
FVG Detector: Identify and label Fair Value Gaps, with age, status & multi-timeframe support.
The ZigZag Trend is a market structure tool that filters out small price fluctuations and highlights major swing.
QuickSmart One-Click Indicator — Point. Click. Smart Risk.
MainChart_EMA_BB is a main‑chart overlay indicator for cTrader that combines:
LPA simplifies trading by coloring candles with volume data and RSI levels for trend and reversal insights.
MacD Custom Indicator-Multiple Time Frame
🧭 See when your market tends to move—by Month, Day-of-Week, or Hour-of-Day🧭
Regression channels with Fibonacci levels across multiple regression types, timeframes, and custom date ranges.
Trading Concept Suite: OBs, FVGs, Structure, Liquidity, Killzones & MTF overlay. Every concept in one cTrader indicator.
Trend filter based on Alfred François Tagher's price-time methodology. Identifies trends when close breaks prior period'
"MACD Plus" logo
5.0
(2)
Free
A visually enhanced MACD with colored histograms to clearly show trend strength.
The standard Relative Strength Index (RSI), RSI & Signal Cloud, Smart Volatility Filter (ATR), On-Chart Info Dashboard
Detect institutional breakout zones with smart volume & channel analysis — by PrimeQuant.
WICK COMMANDER — Know Exactly When the Market Commits
The Multi-Timeframe Candle Indicator displays candles from multiple timeframes in one window, enhancing market analysis!
Since 14/07/2025
49
Sales