"MAGIC LIQUIDITY PRO" logo
MAGIC LIQUIDITY PRO
"MAGIC LIQUIDITY PRO" uploaded image
86
Sales
5.26K
Free installs

The MagicLiquidity indicator is an advanced tool that identifies liquidity zones, order blocks, and stop-loss levels in the market, helping traders identify key support/resistance areas and potential reversal points.


Main Concepts

Order Blocks: Areas where large market participants may have placed significant orders

Liquidity Pools: Levels where there is a concentration of stops or pending orders

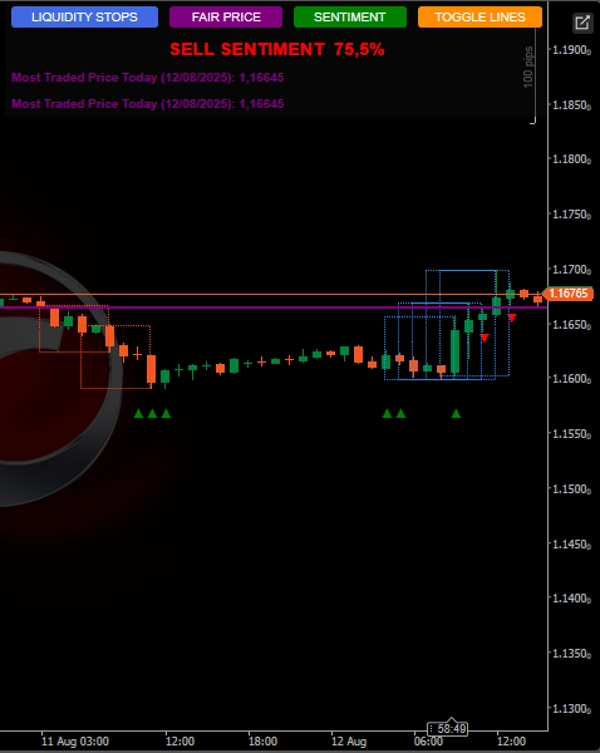
Most Traded Price Fair Price: The price level with the highest trading volume of the day

How the Indicator Works

Order Block Identification

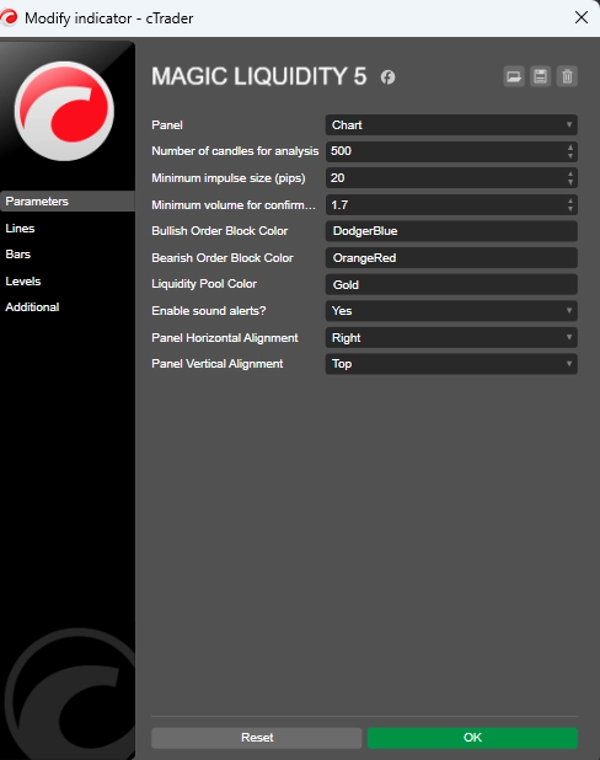
Detects impulsive movements a configurable minimum size in pips

Identifies consolidations after these movements

Classifies as a bullish or bearish block based on the direction of the impulse

Liquidity Pool Detection

Identifies highs and lows in the analyzed period

Tracks levels above and below the current price

Counts how many liquidity pools have been liquidated reached
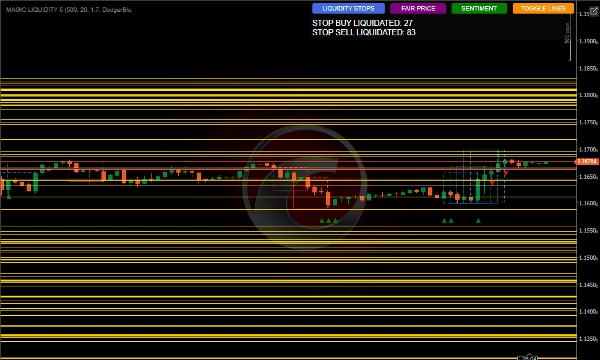
Information Panel

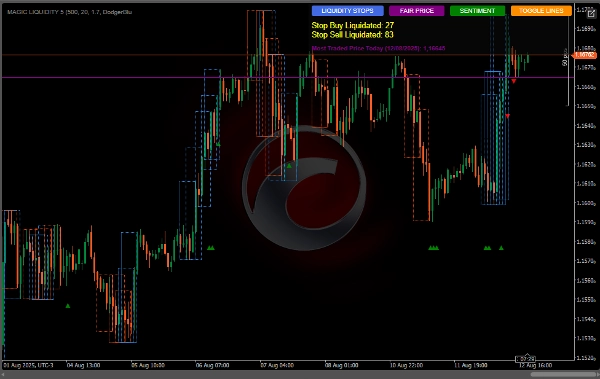
Shows the count of buy/sell stops liquidated

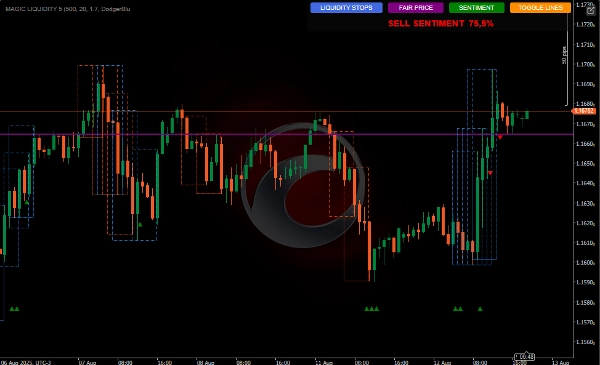
Displays market sentiment bullish/bearish

Shows the most traded price day

Allows you to enable/disable the display of lines

Volume confirmation

Reversal pattern

Stop loss above the block

Trading Liquidity

Buy Stop Liquidation: When the price reaches a liquidity pool above:

May indicate buying exhaustion - prepare to sell

Entry after reversal confirmation

Sell Stop Liquidation: When the price reaches a liquidity pool below:

May indicate selling exhaustion - prepare to buy

Entry after reversal confirmation


Using Sentiment

When there are more liquidity pools liquidated above: bias Sell-side

When there are more liquidity pools liquidated below: buy bias

Use as a filter to align trades with prevailing sentiment

Most Traded Price (Fair Price)

Can serve as a breakeven level

Trades above: bullish bias

Trades below: bearish bias

Can be used as a target or reversal point


.

Indicator profile
0.0
Reviews: 0
Customer reviews
No reviews for this product yet. Already tried it? Be the first to tell others!
Products available through cTrader Store, including trading bots, indicators and plugins, are provided by third-party developers and made available for informational and technical access purposes only. cTrader Store is not a broker and does not provide investment advice, personal recommendations or any guarantee of future performance.

More from this author

Order BlockIndicator reversal
Precision Scalper,XAUUSD ,Averages that functions like a multidimensional radar:
34.8%
2.12
Profit factor
5%
Max drawdown
Intelligent negotiations and analysis!
47.3%
3
Profit factor
2%
Max drawdown
Intelligent system, Available any instrument. Profit 12. Drawdown 1%
Volume Profile Price Period and Live VAH,VAL,POC,
Chart Patterns Algo Bot
Profitable low-risk robot, ROI 32% month, live,
36.8%
3.4
Profit factor
7%
Max drawdown
INDICATOR,LIQUIDITY POOLS,ACCURATE SIGNAL, NO DELAY,80% PROBABILITY
PVA Volume Analysis Indicator:Price volume over trend strength and direction
Trend analysis, automatic analysis, position, swingtrader, scalper
Indicator,combines with several strategies.MA locate trends,pullback, signal volumes, reversals, support and resistance
POSITION 5000 Pips: The Ultimate Algorithm for Gold
16.8%
4
Profit factor
5%
Max drawdown

You may also like

Hurst HCCO Advanced / Cycle Phase Detection / Volatility Filter / Info Table / Momentum Histogram
Smart Money Breakout Channels – Auto-detect breakout zones with price, volume & volatility insights on cTrader.
IVB 2.0 is an indicator that works on the strategy of imbalance of the maximum volatility box of indices
A powerful RSI-based hunter that detects early reversals and snipes market turning points with high accuracy.
🔍 Automatically detect support and resistance levels based on "swings" or pivots
Feather Gauge – Forex Sentiment Indicator The Feather Gauge is a visual sentiment indicator designed to represent marke
AlphaTrend Pro by LudwigICT
Useful indicator for traders who want to visualize key price levels based on previous daily highs and lows.
Dynamic Candle Timer is a fully customizable feature-packed indicator that offers multiple count-down/up modes and...
Visual Trend Momentum is a MA/ATR/Volume trend tool. Visual signals for strong trends & reversals. Customizable. 📈📉
Multi Time Frame Fair Value Gap (FVG) Indicator
Complete ICT Killzones: 5 sessions, easy colors, transparency controls & session info. Professional timing for cTrader.
Trade with the hidden edge — identify bullish and bearish dominance instantly
"VWAP Pro" logo
5.0
(4)
Free
Advanced VWAP with up to 30 anchored levels, multiple timeframes, memory mode, standard deviation bands & simple GUI
Advanced EMA indicator with dynamic color trend, slope strength & smart filters for clean, high-probability trading sign
Lightweight ZigZag tool for clear structure, swing highs/lows and liquidity-based analysis.
Indicatore dei livelli numeri tondi sul grafico , regolabile.Indicator of levels round numbers on the graph, adjustable
this indicaotr show distance between Tenkan to Kijun, Close to Kijun and Close to Tenkan 
86
Sales
5.26K
Free installs