
Market BIAS AI
Indicator
Version 1.0, Aug 2025
Windows, Mac

The Market BIAS AI Indicator is a technical analysis tool built for cTrader that helps traders quickly identify market direction bias using a simple and effective alignment strategy.
This tool is designed for traders who want to simplify trend detection and focus on setups aligned with the overall market direction.
🔹 How it Displays on the Chart?
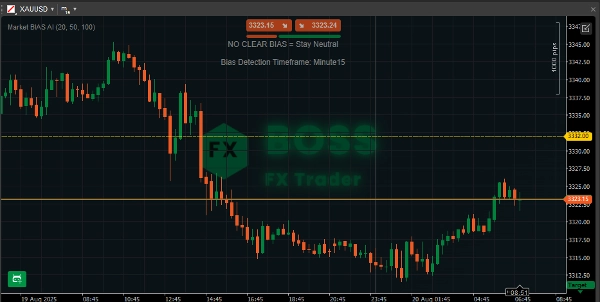
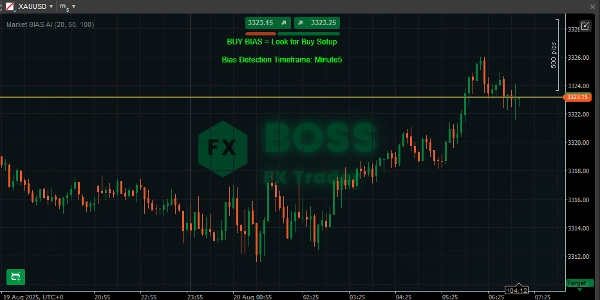
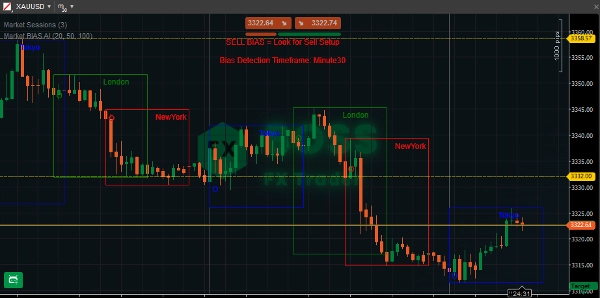
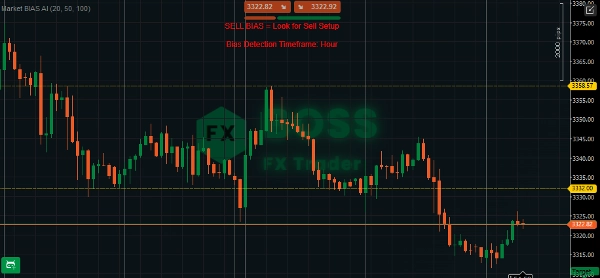
- Displays one of three messages in the center-top of the chart:
- ✅ BUY BIAS = Look for Buy Setup (Green)
- ✅ SELL BIAS = Look for Sell Setup (Red)
- ⚪ NO CLEAR BIAS = Stay Neutral (Gray)
- Underneath, it also shows the Bias Detection Timeframe (the chart’s timeframe).
Example: “Bias Detection Timeframe: H1”
This ensures you always know which timeframe bias you’re trading with.
🔹 How to Use It
- Attach the Indicator
- Open cTrader → go to your chart.
- Right-click → “Indicators” → select Market BIAS AI.
- Or drag and drop it onto your chart.
- Choose Timeframe
- The indicator works on any timeframe.
- If you want to trade intraday, use M15 / H1.
- For swing trading, use H4 / D1.
- Interpret the Signal
- 🟢 BUY BIAS → Only look for buying opportunities (e.g., bullish price action setups, pullbacks into support).
- 🔴 SELL BIAS → Only look for selling opportunities (e.g., bearish price action setups, rallies into resistance).
- ⚪ NO CLEAR BIAS → Avoid trading or wait for a clearer trend.
- Combine with Entry Triggers
- The indicator gives directional bias, not exact entry signals.
- Best practice: combine with candlestick patterns, support/resistance, or other entry confirmations.
"Enjoy being one of the Profitable traders."
Indicator profile
0.0
Reviews: 0
Customer reviews
No reviews for this product yet. Already tried it? Be the first to tell others!
Products available through cTrader Store, including trading bots, indicators and plugins, are provided by third-party developers and made available for informational and technical access purposes only. cTrader Store is not a broker and does not provide investment advice, personal recommendations or any guarantee of future performance.


!["Wyckoff Toolkit [Iridio Capital]" logo](https://cdn.ctrader.com/image/webp/8acfe6a1-6a8e-4578-9367-9df3af2b1801_27763)


Since 29/05/2025
3.03M
Traded volume
45.22K
Pips won
28
Sales
740
Free installs