Description
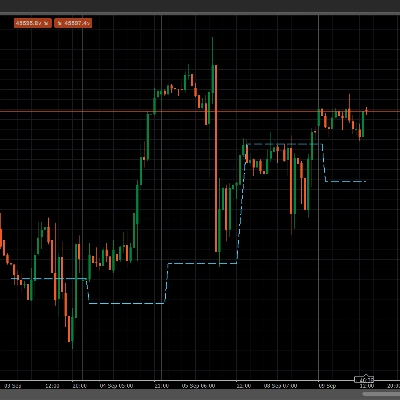
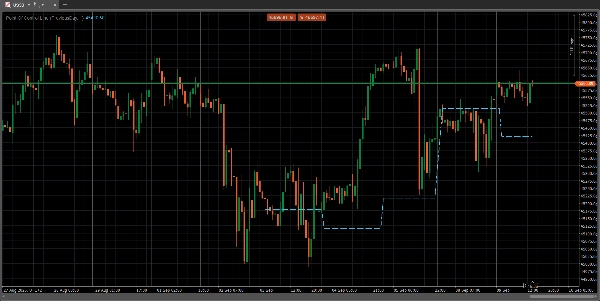
The Point of Control is a price level on a volume profile chart where the most trading volume has been conducted within a specified period. This level acts as a significant support or resistance zone because it represents a price where large trading institutions were most active and where market price found consensus. Traders use the line to identify key price zones, gauge market sentiment, and anticipate potential price movements and reversals
Summary
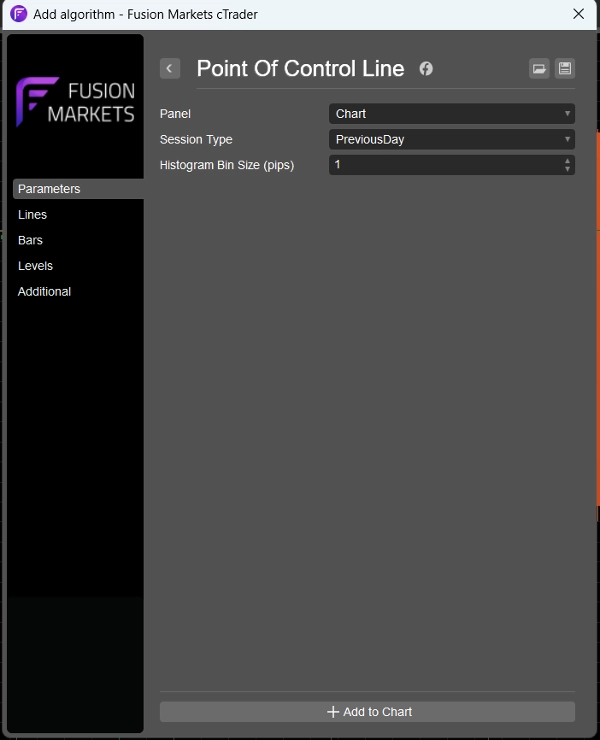
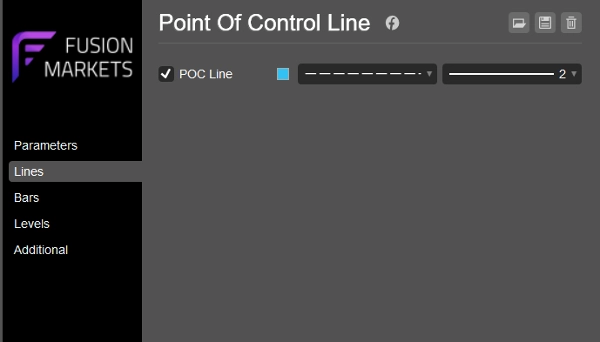
Indicator profile
Customer reviews
0.0
Reviews: 0
Customer reviews
No reviews for this product yet. Already tried it? Be the first to tell others!
Discussion
FAQ
Forex
Indices
Products available through cTrader Store, including trading bots, indicators and plugins, are provided by third-party developers and made available for informational and technical access purposes only. cTrader Store is not a broker and does not provide investment advice, personal recommendations or any guarantee of future performance.
More from this author


!["Gaussian Channel [Iridio Capital]" logo](https://cdn.ctrader.com/image/webp/7c039209-5573-4a54-a072-f9528b503103_41960)


Price
Since 21/04/2025