Indicator
Indices
Commodities
Forex
Signal
Crypto
AI
Technical self-analysis Pro
"Technical self-analysis Pro" logo
29/10/2025
Desktop
"Technical self-analysis Pro" uploaded image"Technical self-analysis Pro" uploaded image"Technical self-analysis Pro" uploaded image"Technical self-analysis Pro" uploaded image

TECHNICAL ANALYSIS, WITH SOUND ALERT


The TECHNICAL ANALYSIS indicator is an advanced technical analysis solution developed for the cAlgo platform, integrating multiple technical indicators focused on identifying robust trends, market momentum, and volume confirmation. It combines the ADX (Average Directional Index) with slope analysis, volume filtering, and real-time multi-indicator technical analysis, offering traders a comprehensive and reliable view for decision-making.


🔍 Main Strategy

1. Base: ADX + DI (Directional Movement System)

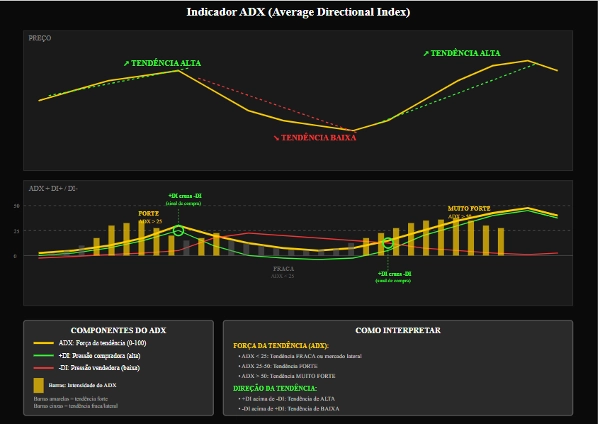
The core of the indicator is the ADX (Average Directional Index), which measures the strength of the trend.

The +DI (Positive Directional Indicator) and -DI (Negative Directional Indicator) components identify the direction of the trend:

+DI > -DI → Uptrend

-DI > +DI → Downtrend

2. Dynamic Momentum Analysis with Slope

The slope of the ADX, +DI, and -DI is calculated using linear regression.

This allows identifying whether the trend is:

Gaining strength (positive slope)

Losing strength (negative slope)
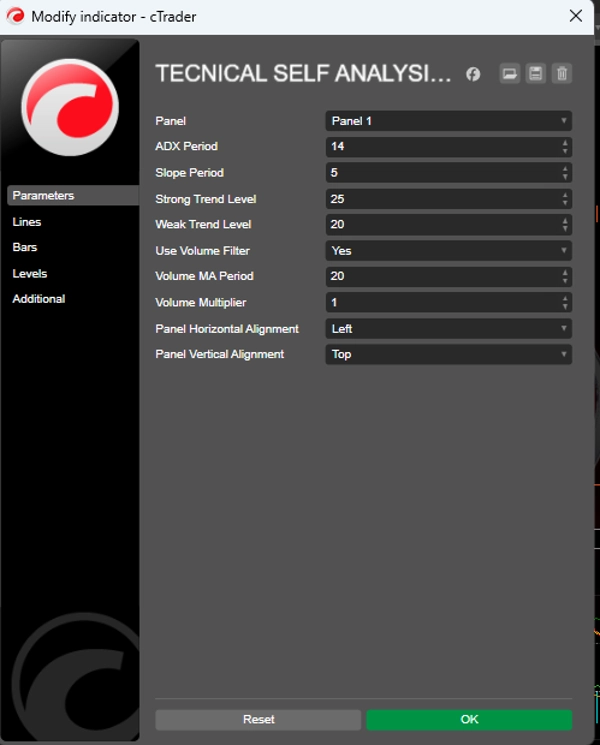
3. Reference Levels

Strong Trend Level: Level above which the trend is considered strong (default: 25)

Weak Trend Level: Minimum level to consider a valid trend (default: 20)

Trends below the weak level are treated as sideways or without a clear direction.

📈 Signal Generation

Buy Conditions

✅ +DI crossing above -DI

✅ ADX above the weak trend level (Weak Trend Level)

✅ Positive ADX and +DI slopes

✅ Volume confirmation (optional)


Sell Conditions

✅ -DI crossing above +DI

✅ ADX above the weak trend level (Weak Trend Level)

✅ Positive ADX and -DI slopes

✅ Volume confirmation (optional)


Strong Signals: When the ADX is above the Strong Trend Level and the slopes are significantly positive, the indicator generates reinforced signals, avoiding consecutive repeated entries. 📊 Volume Filter (Optional)

The indicator may require volume confirmation before generating signals.

The current volume must be greater than or equal to the moving average of the volume × multiplier.

This helps filter out false breakouts and signals in illiquid markets.

🧠 Advanced Technical Analysis (Interactive Panel)

TECHNICAL ANALYSIS includes two interactive panels on the chart:
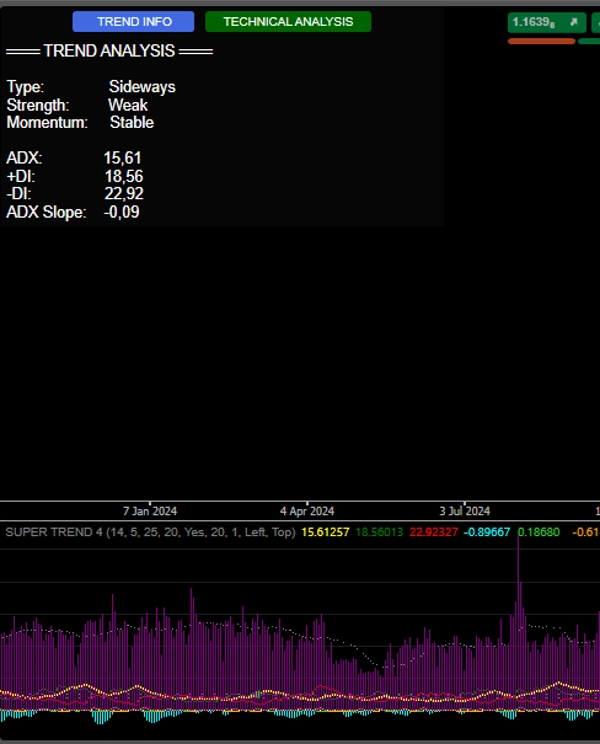

1. TREND INFO

Trend Type: Uptrend / Downtrend / Sideways

Trend Strength: Strong / Weak

Momentum: Strengthening / Weakening / Stable

Current ADX, +DI, -DI and Slope values

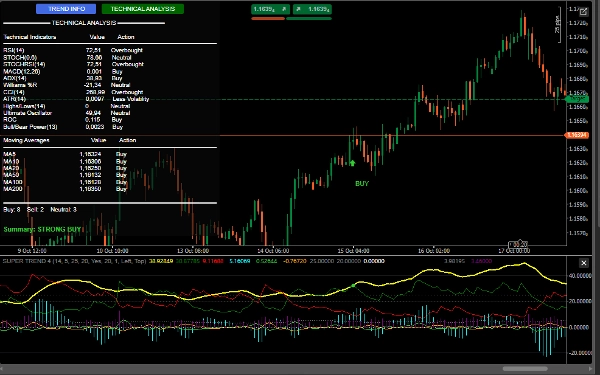
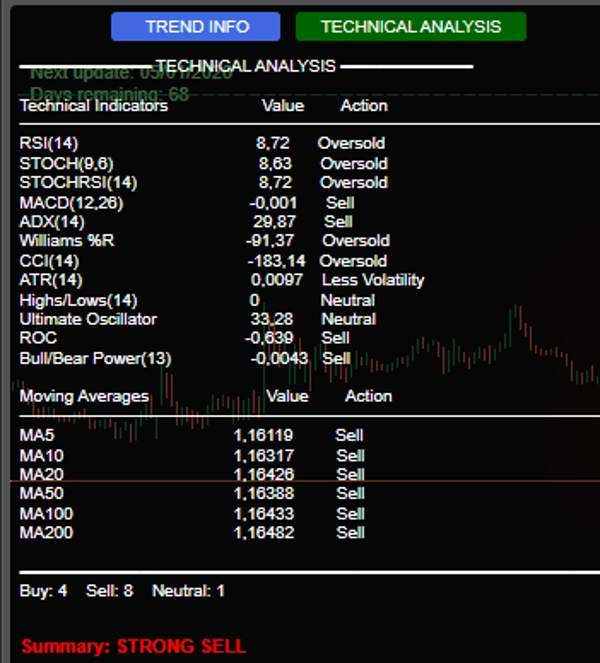
2. TECHNICAL ANALYSIS

Performs a real-time multi-indicator analysis, including:


RSI(14) – Overbought/Oversold

Stochastic(14) – Momentum

MACD(12,26) – Crossings and divergences

Williams %R – Market extremes

CCI(14) – Deviations from the typical price

ROC(12) – Rate of change

Ultimate Oscillator – Strength confirmation

Bull/Bear Power – Buy/Sell pressure

Moving Averages (5,10,20,50,100,200) – Long-term trend

Final Summary: The system counts the buy/sell/neutral signals and issues a clear recommendation:


STRONG BUY (≥7 buy signals)

BUY

SELL

STRONG SELL (≥7 sell signals)

NEUTRAL

🔔 Alerts and Visualization

Visual signals on the chart:

Green/red arrows with "BUY"/"SELL" labels

Sound notifications (Windows)

Detailed logs in the console with:

Signal time

ADX, DI and volume values ​​(if enabled)


🛡️ Vantagens Competitivas

✅ Integração de múltiplos indicadores em um único painel

✅ Foco na força e direção da tendência (não apenas preço)

✅ Filtro de volume para maior confiabilidade

✅ Interface interativa e informativa

✅ Sinais claros com alertas visuais e sonoros


0.0
Reviews: 0
Customer reviews
No reviews for this product yet. Already tried it? Be the first to tell others!
More from this author
Block Order Rreversal
Order BlockIndicator reversal
cBot
Indices
RSI
Breakout
+1
CHART PATTERN BOT
Chart Patterns Algo Bot
PVA Volume+Analysis_noSourceCode
PVA Volume Analysis Indicator:Price volume over trend strength and direction
cBot
Indices
RSI
ATR
+3
NEXUS PRIME V3
Intelligent system, Available any instrument. Profit 12. Drawdown 1%
Indicator
Signal
Master Dragom SR
Indicator,combines with several strategies.MA locate trends,pullback, signal volumes, reversals, support and resistance
cBot
Forex
EURUSD
AI
+1
GRADIENTE LINEAR FOREX_noSourceCode
Sophisticated GRADIENTE algorithm , performance 11% per day drawdown 4%
Indicator
Breakout
Commodities
Forex
+3
MAGIC BLOCK STRATEGY
Block Liquidity,indicator.Block Order, Liquids Stops, Signal Sentiment,signal correction
BLOCK LIQUIDITY PRO
Block Liquidity,indicator.Block Order, Liquids Stops, Signal Sentiment,signal correctio.
cBot
XAUUSD
Scalping
Precision Scalper v1.1
Precision Scalper,XAUUSD ,Averages that functions like a multidimensional radar:
Indicator
NAS100
NZDUSD
RSI
+11
Pattern Signal Forex
Indicator pattern signal moment
Blocks Liquidity MGC
BlocksLiquidity Indicator Analysis!
cBot
Stocks
Forex
Quark Forex Paid 1
Quark automatic system Three Strategies
Indicator
Forex
EURUSD
EconomicForex
ECONOMIC FOREX:provides insights into inflation, nominal interest rates and real interest rates, in the line chart
cBot
Grid
RSI
ATR
+3
NEBULA EDGE IA
Adaptive decision-making AI ROBOT that evolves with the market, dynamic risk management and ML optimization.
Indicator
NAS100
Indices
RSI
+9
LIQUIDITY POOLS SIGNAL FREE
INDICATOR,LIQUIDITY POOLS,ACCURATE SIGNAL, NO DELAY,80% PROBABILITY
cBot
Stocks
Forex
Linear Gradiente v3
GRADIENTE LINEAR algorithm , performance 11% per day drawdown 4%
Indicator
Indices
Commodities
Forex
+2
Technical self-analysis v4
Technical self-analysis, WITH SOUND ALERT
cBot
Grid
Indices
RSI
+8
NEXUS STARTER 1.3
Intelligent system, Available any instrument. Profit 9. Drawdown 2%
You may also like
Repiptor Candlescope Lite
Candlestick pattern detector lite version
Indicator
ATR
Forex
Signal
+4
Follow Line
The Follow Line Indicator is a versatile tool designed to identify market trends and provide accurate buy/sell signals.
ICT Killzones & Macros
KILLZONES AND MACRO SESSIONS
Indicator
NAS100
NZDUSD
Martingale
+26
Support & Resistance Pro
The Support & Resistance Pro helps traders identify key support and resistance levels for informed trading decisions.
Range 10 Rsi
RSI Scalping cBot: quick‑fire trades on choppy symbols.
Indicator
NAS100
XAUUSD
FVG
+11
Fair Value Gaps_FVG_MTF
Multi-TF FVG + Smart Fibonacci
Indicator
Signal
MACD
USDJPY
PulseTracker
Version 1.2: Advanced Trend Detection & Visualization System
Indicator
Bollinger
Repiptor BB Colored Width
Colored Bollinger Bands Width
Indicator
Indices
Stocks
Forex
+1
Bullet Chart Trend
Unique Pyramid Design , Clear Price Action Trend
Indicator
Indices
MFI-MTF
Multi-timeframe Money Flow Index
Renko 4k Pips
Custom your Renko Brick how do you wish!
Indicator
Indices
Breakout
Forex
+2
Time zone pro
FREE Global Trading Sessions Indicator
DMI CUSTOM SESSIONS
This will allow you to have SESSIONS on the chart. London, New York, Asian session and you can customize the times.
Decision Point
Decision Point
Indicator
NAS100
NZDUSD
XAUUSD
+10
Relative Moving Average
Bring the RMA to cTrader! This is the Relative Moving Average from TradingView.
Indicator
Forex
Crypto
VegaXLR - Bar Close Alert Manager
Bar Close Alert Manager provides real-time alerts for bar closures with customizable notifications and automation.
Indicator
NAS100
RSI
NZDUSD
+15
HAIQuantum_TheGame
This trading game allows you to explore and practice investment strategies in a real-time market data environment.
Top-rated
"STC" logo
5.0
(2)
Free
STC
Schaff Trend Cycle (STC) Indicator