
Dynamic Trend Flux
Indicator
Version 1.0, Nov 2025
Windows, Mac
4.0
Reviews: 1
Description
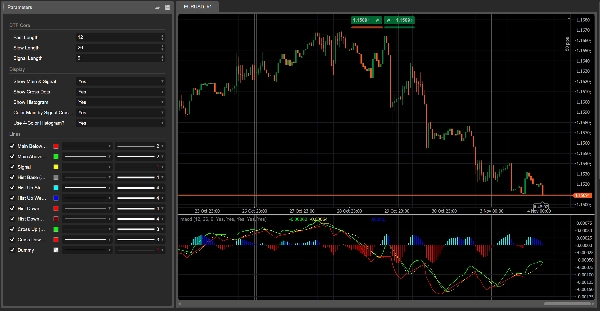
Dynamic Trend Flux
Type: Momentum / trend oscillator (MACD-style, multi-color)
What it does
Dynamic Trend Flux is a colored momentum oscillator based on the classic fast/slow EMA difference plus a signal line.
It helps you see at a glance:
- when momentum is bullish or bearish,
- whether momentum is strengthening or weakening,
- and where trend shifts occur (crosses of main vs signal line).
The indicator draws:
- Main line (Flux line)
- built from the difference between a fast and a slow EMA
- changes color depending on whether it is above or below the signal line (optional).
- Signal line
- a moving average of the main line, used as a smoother trigger.
- Histogram with 4 colors (optional)
- shows the distance between main and signal,
- color encodes both direction (above/below zero) and change of strength from bar to bar.
- Dots on crosses (optional)
- highlights where the main line crosses the signal line → potential trend phase changes.
All calculations are performed on the current chart timeframe.
How to read it
1. Zero line
- Values above zero → bullish pressure dominates.
- Values below zero → bearish pressure dominates.
2. Colored histogram
With 4-color mode ON:
- Aqua → above zero and rising
- strong / increasing bullish momentum.
- Blue → above zero but falling
- bullish trend still on, but momentum cooling down.
- Red → below zero and falling
- strong / increasing bearish momentum.
- Maroon → below zero but rising
- bearish phase still on, but momentum losing strength.
This makes divergences and momentum shifts much easier to spot visually.
3. Main & Signal lines
- Main line above Signal → bullish phase.
- Main line below Signal → bearish phase.
If color-change is enabled:
- Main line Lime = above Signal (bullish control)
- Main line Red = below Signal (bearish control)
4. Cross dots
- Green dot (Cross Up) → main crosses above signal
- possible start of a bullish swing.
- Red dot (Cross Down) → main crosses below signal
- possible start of a bearish swing.
Always combine these signals with structure / price action and higher-timeframe context.
Parameters (English)
DTF Core
- Fast Length – period of the fast EMA (default 12).
- Slow Length – period of the slow EMA (default 26).
- Signal Length – period of the signal SMA applied to the main line (default 9).
Display
- Show Main & Signal – toggles the two lines.
- Show Cross Dots – show dots on main/signal crossings.
- Show Histogram – toggles the histogram behind.
- Color Main by Signal Cross?
- ON → main line Lime above signal, Red below.
- OFF → main line stays Red.
- Use 4-Color Histogram?
- ON → aqua / blue / red / maroon logic.
- OFF → histogram is a single gray color.
Summary
Indicator profile
Customer reviews
4.0
Reviews: 1
5 | 0 % | |
4 | 100 % | |
3 | 0 % | |
2 | 0 % | |
1 | 0 % |
Discussion
FAQ
Signal
Indices
Commodities
GBPUSD
RSI
Bollinger
Fibonacci
Scalping
AI
XAUUSD
NAS100
MACD
BTCUSD
Forex
Breakout
EURUSD
NZDUSD
Martingale
Prop
ZigZag
Supertrend
Fair Value Gap
SMC
Crypto
Grid
Stocks
ATR
USDJPY
VWAP
Products available through cTrader Store, including trading bots, indicators and plugins, are provided by third-party developers and made available for informational and technical access purposes only. cTrader Store is not a broker and does not provide investment advice, personal recommendations or any guarantee of future performance.


!["Gaussian Channel [Iridio Capital]" logo](https://cdn.ctrader.com/image/webp/7c039209-5573-4a54-a072-f9528b503103_41960)


Price
42.11M
Traded volume
6.13M
Pips won
222
Sales
8.38K
Free installs