KDJ
5.0
03/09/2025
143
Desktop
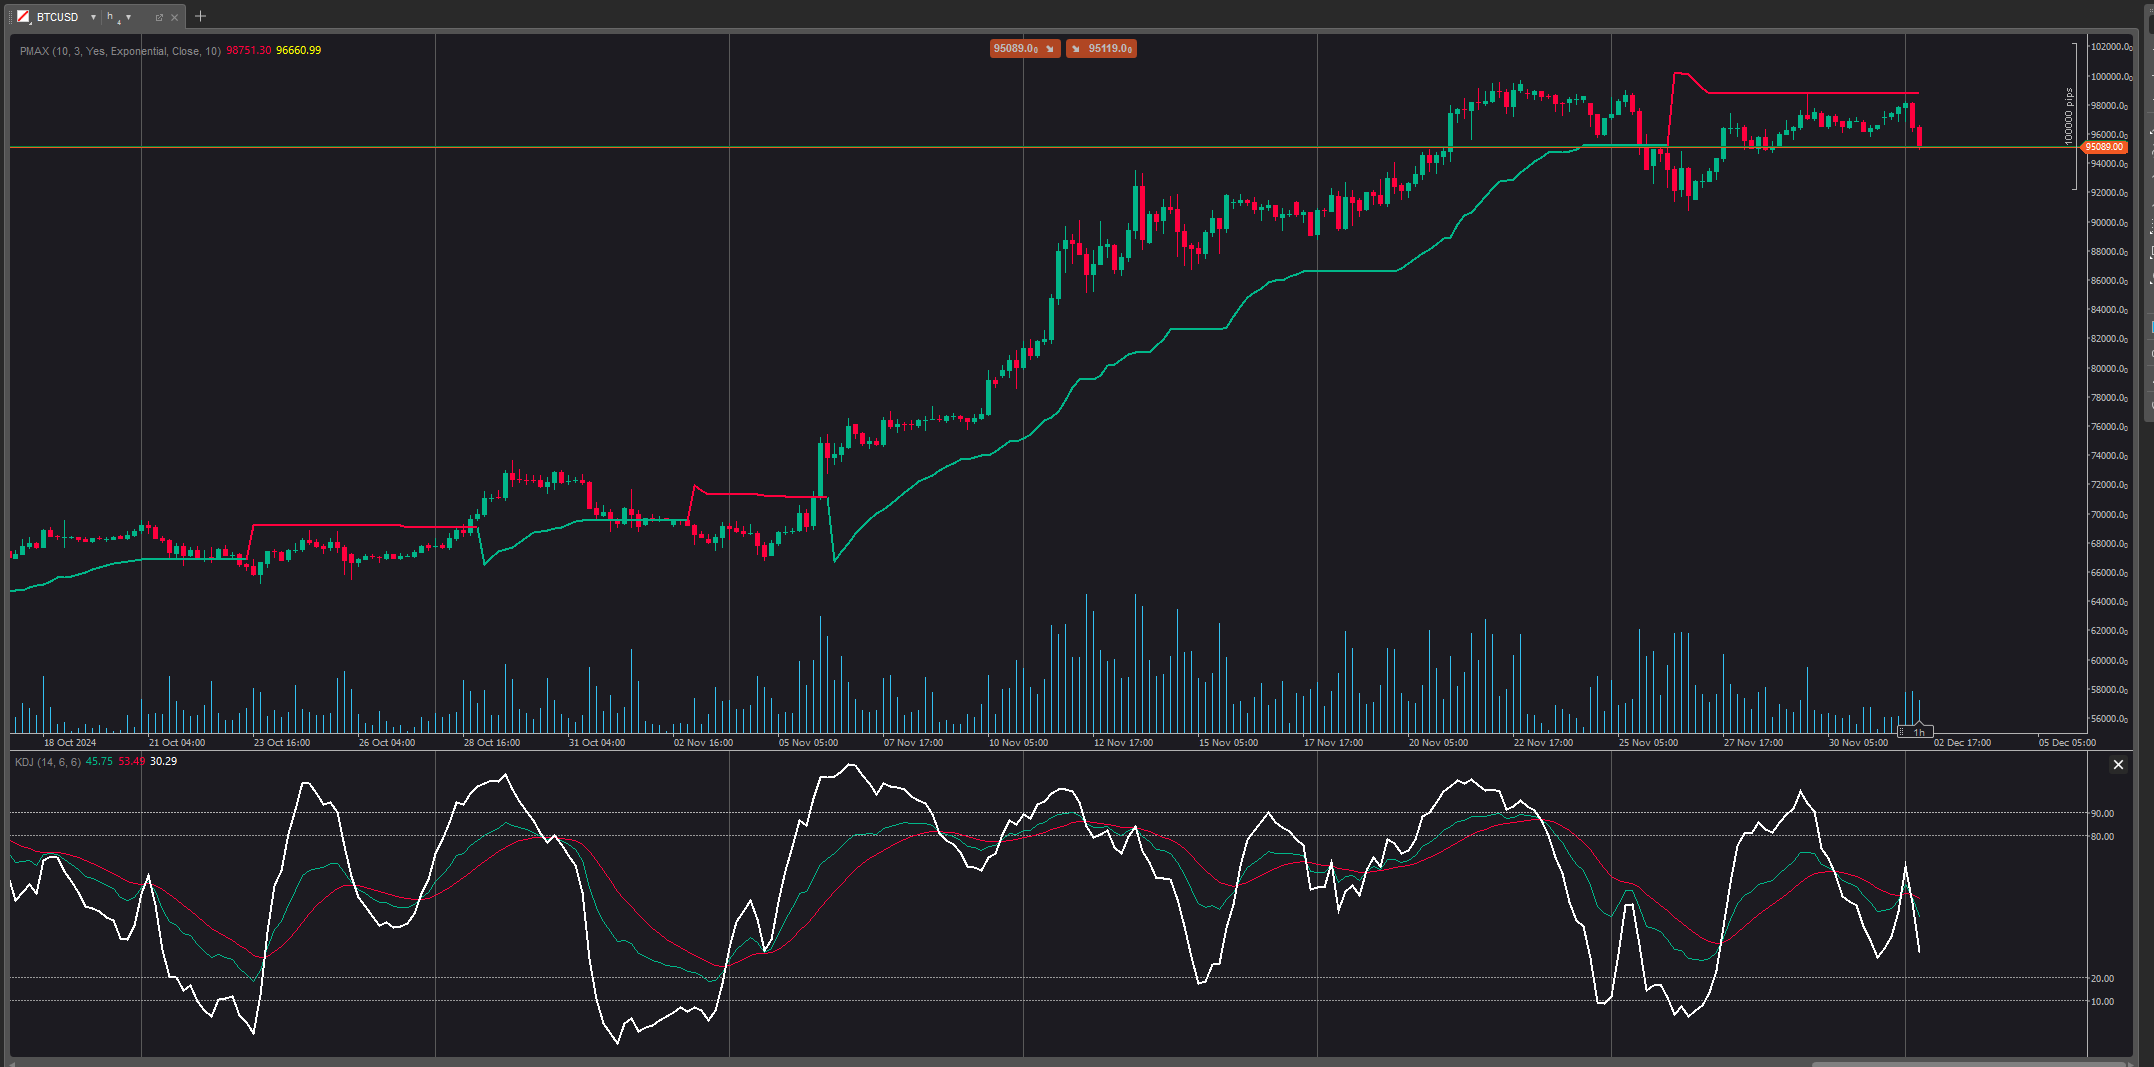
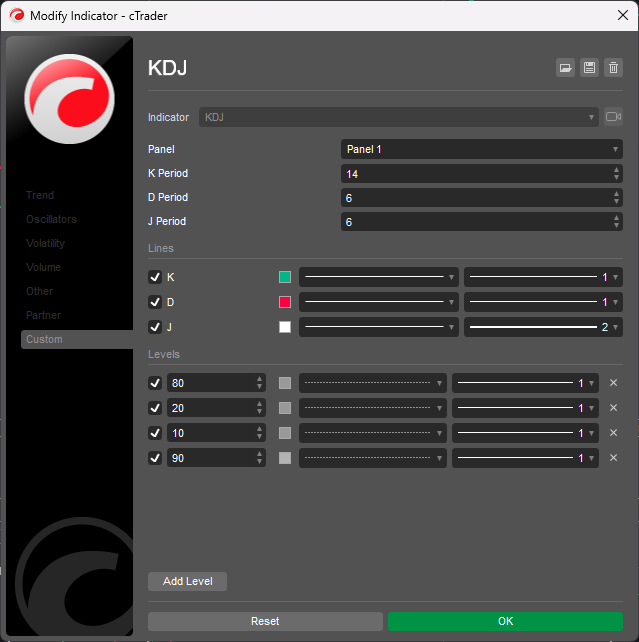
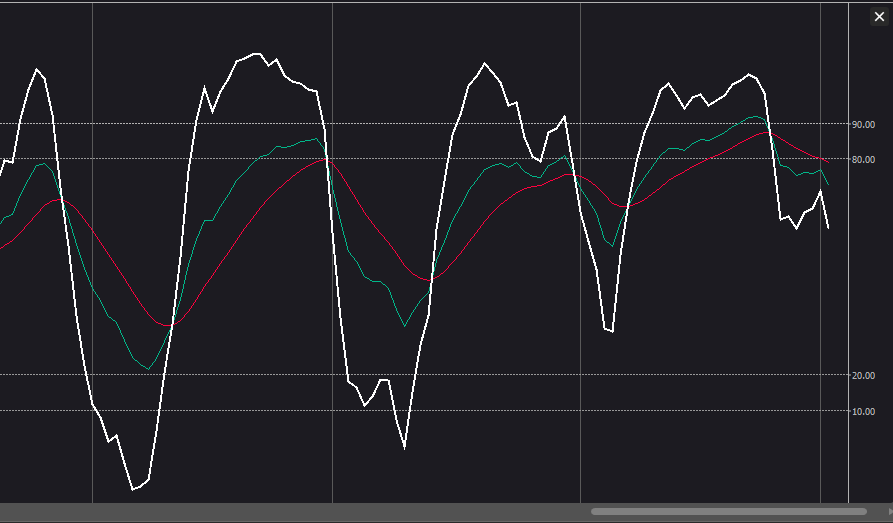
The KDJ oscillator display consists of 3 lines (K, D and J - hence the name of the display) and 2 levels. K and D are the same lines when using the stochastic oscillator. The J line represents the deviation of the D value from the K value. The convergence of these lines indicates new trading opportunities. Like the Stochastic Oscillator, oversold and overbought levels correspond to the times when the trend is likely to reverse.
More from this author


You may also like
!["[Stellar Strategies] Wave Trend Pro" logo](https://market-prod-23f4d22-e289.s3.amazonaws.com/8c93438a-6b0a-4026-93b2-0694329a3bc1_cT_cs_4141285_EURUSD_2025-04-25_17-52-31.png)


!["[Hamster-Coder] Moving Average" logo](https://market-prod-23f4d22-e289.s3.amazonaws.com/fd853887-8360-4212-b037-22b554a23dc6_hamster-coder-2.jpg)
 Small.jpeg)