Penerangan
Kekuatan Pasangan (JPY) - Penunjuk Kekuatan Mata Wang
📊 Apakah Kekuatan Pasangan (JPY)?
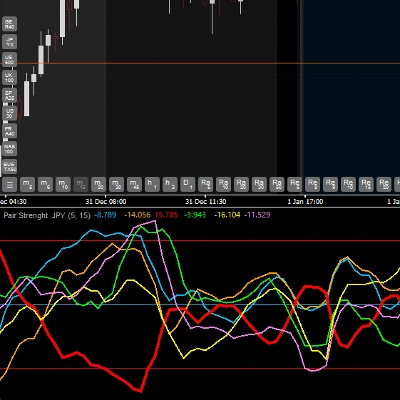
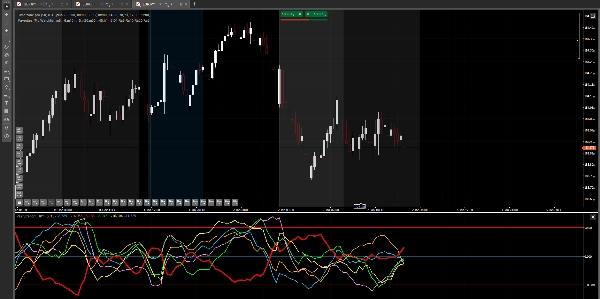
Kekuatan Pasangan (JPY) adalah penunjuk lanjutan yang menganalisis dan membandingkan kekuatan relatif 6 mata wang utama secara masa nyata: EUR, GBP, JPY, USD, AUD, dan CAD. Ia menggunakan True Strength Index (TSI) untuk mengukur momentum dan kekuatan setiap mata wang, membolehkan anda mengenal pasti mata wang mana yang lebih kuat atau lemah di pasaran.
🎯 Ciri Utama
✅ Analisis Multi-Mata Wang: Pantau 6 mata wang serentak dalam satu tetingkap ✅ Pengenalpastian Trend: Kenal pasti mata wang terkuat dan terlemah di pasaran ✅ Isyarat Jual Beli Berlebihan: Tahap pada 50, 0, dan -50 untuk mengenal pasti keadaan ekstrem ✅ Pengesahan Dagangan: Membantu mengesahkan kemasukan anda dengan membandingkan kekuatan relatif ✅ Visual dan Jelas: Setiap mata wang mempunyai warna tersendiri untuk pengenalan mudah
💹 Pasangan Serasi
PENTING: Penunjuk ini menganalisis kekuatan 6 mata wang: EUR, GBP, JPY, USD, AUD, dan CAD
Penunjuk ini berfungsi HANYA dengan pasangan yang termasuk JPY (Yen Jepun), bermakna:
- EURJPY (Euro / Yen)
- GBPJPY (Pound / Yen)
- USDJPY (Dollar / Yen)
- AUDJPY (Dollar Australia / Yen)
- CADJPY (Dollar Kanada / Yen)
⚠️ Broker anda MESTI menawarkan 5 pasangan ini dengan JPY supaya penunjuk berfungsi dengan betul.
Tidak berfungsi dengan:
- Emas, perak, atau logam lain
- Indeks saham
- Mata wang kripto
- Pasangan yang tidak termasuk JPY (seperti EURUSD, GBPUSD, dll.)
Anda boleh menggunakan penunjuk pada carta mana-mana 5 pasangan yang disebut di atas.
📈 Cara Menggunakan Penunjuk
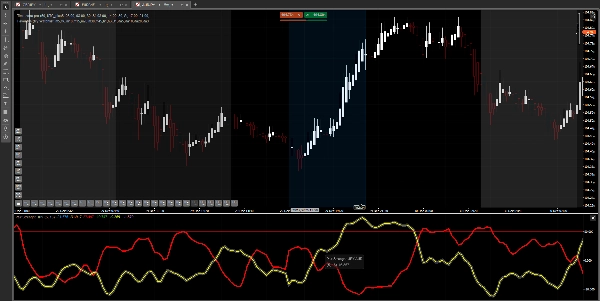
Interpretasi Garis:
Setiap garis berwarna mewakili kekuatan mata wang:
- Garis naik (nilai positif): Mata wang adalah KUAT
- Garis turun (nilai negatif): Mata wang adalah LEMAH
- Persilangan garis: Perubahan dalam kekuatan relatif antara mata wang
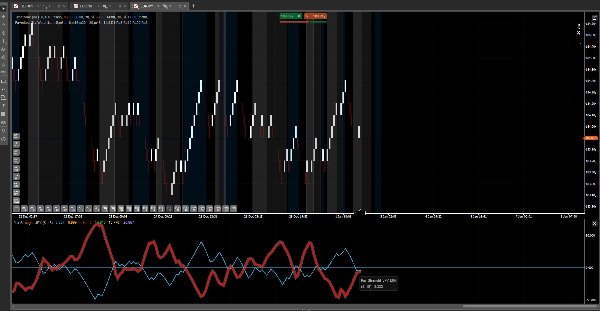
Tahap Utama:
- Tahap 50: Zon beli berlebihan - Mata wang mungkin sangat kuat dan hampir berbalik arah
- Tahap 0: Garis neutral - Keseimbangan antara kekuatan dan kelemahan
- Tahap -50: Zon jual berlebihan - Mata wang mungkin sangat lemah dan hampir berbalik arah
Strategi Asas:
- Kenal pasti mata wang TERKUAT (garis tertinggi)
- Kenal pasti mata wang TERLEMAH (garis terendah)
- Dagangkan pasangan yang menggabungkan kedua-duanya (contoh: jika EUR kuat dan JPY lemah → beli EURJPY)
- Sahkan dengan tahap: Elakkan membeli apabila mata wang kuat berada pada +50 atau menjual apabila yang lemah berada pada -50
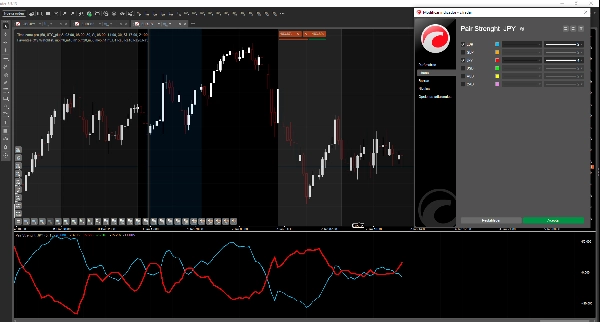
⚙️ Parameter Boleh Laras
- Tempoh Pantas (Default: 5): Tempoh pantas TSI - nilai lebih rendah = lebih sensitif
- Tempoh Perlahan (Default: 15): Tempoh perlahan TSI - nilai lebih tinggi = lebih lancar
Nilai lalai berfungsi dengan baik untuk kebanyakan situasi. Laraskan mengikut gaya dagangan anda.
🔮 Kemas Kini Masa Depan
Kami sedang menilai kemungkinan menambah lebih banyak pasangan mata wang (NZD, CHF, dll.) dalam versi akan datang, bergantung pada maklum balas dan respons pengguna. Walau bagaimanapun, ini tidak dijamin dan akan bergantung pada prestasi penunjuk dan permintaan pasaran.
💡 Petua Penggunaan
✓ Gunakan bersama strategi utama anda, bukan sebagai sistem berdiri sendiri ✓ Gabungkan dengan analisis tindakan harga dan tahap sokongan/rintangan ✓ Berlatih dahulu pada akaun demo sebelum berdagang secara langsung ✓ Tidak semua isyarat adalah pemenang - gunakan pengurusan risiko yang betul ✓ Berfungsi terbaik pada jangka masa M15 dan ke atas
📞 Sokongan
Jika anda mempunyai soalan mengenai pemasangan atau penggunaan penunjuk, hubungi kami.
Nota Akhir: Penunjuk ini adalah alat analisis. Kejayaan dagangan bergantung pada pelbagai faktor termasuk pengurusan risiko, psikologi, dan pengalaman.
Ringkasan
This tool works exclusively with currency pairs that include the Japanese Yen (JPY), specifically EURJPY, GBPJPY, USDJPY, AUDJPY, and CADJPY. It does not support metals, stock indices, cryptocurrencies, or pairs without JPY. Users apply the indicator on any of the five JPY pairs to monitor multi-currency strength simultaneously in one window.
Adjustable parameters include the fast and slow periods of the TSI for sensitivity and smoothing. The indicator aids in trend identification, overbought/oversold signal detection, and trade confirmation by comparing relative currency strength. It is recommended for use alongside other analysis methods and on timeframes of 15 minutes or higher.
Ulasan pelanggan
5 | 100 % | |
4 | 0 % | |
3 | 0 % | |
2 | 0 % | |
1 | 0 % |


