Description
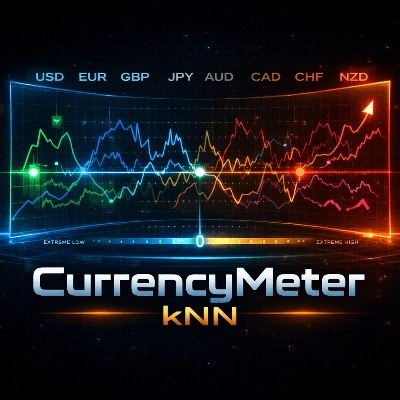
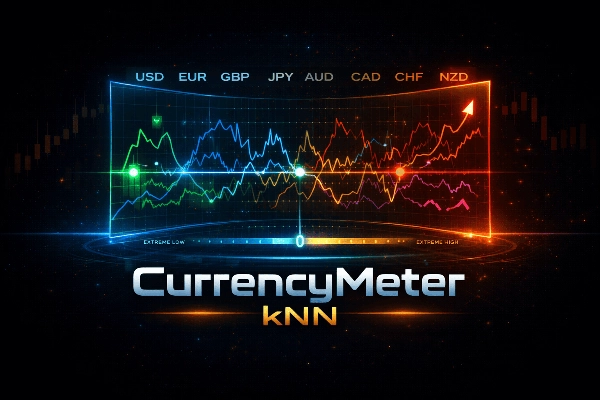
CurrencyMeter kNN is a multi-currency strength meter built for traders who want a clean view of currency flows, and a simple Machine Learning layer to estimate mean-reversion probability.
Unlike classical indicators, it computes strength for the 8 major currencies (USD, EUR, GBP, JPY, AUD, CAD, CHF, NZD) by aggregating information across all pairs, then normalizes it into a compact meter. It uses custom features (such a % return over multiple rolling periods, and 5 others that will be kept secret).
How it works:
- Multi-pair aggregation: For each currency, the meter aggregates multiple overlapping rolling window feautures. This produces an averaged “currency pressure” value per currency.
- Extremes detection with a dynamic threshold: Markets are non-stationary: the statistical properties of price/returns shift over time (volatility, liquidity, macro cycles, session). A fixed threshold often fails because what is “extreme” in one regime no longer works in another.
To reduce that instability, the model uses a dynamic threshold computed from the recent distribution of the meter. It estimates “extreme” as the top tail of recent absolute values (percentile-based). This transforms the raw signal into something closer to stationary behavior, which is easier to model and learn from the kNN.
- Simple kNN model (transparent ML): A k-Nearest Neighbors (kNN) classifier is used to estimate whether an extreme condition tends to revert over a defined horizon.
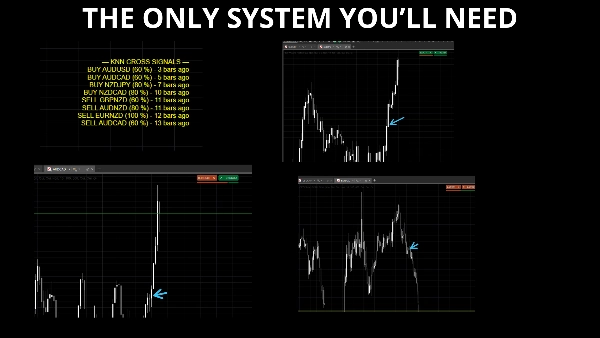
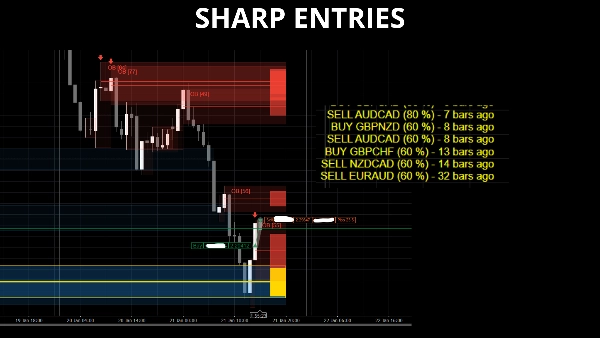
When probability exceeds the Confidence Threshold, the indicator prints a directional alert: BUY X/Y or SELL X/Y.
Features:
- 8 major currencies plotted in one panel
- Multi-pair aggregation
- Dynamic “extreme” threshold based on recent distribution
- kNN probability layer for mean-reversion bias
- Persistent on-panel arrows for recent signals
Notes:
- This is intentionally a simple, transparent ML approach (kNN). It’s not a black box.
- The goal is not “prediction” (which by definition is impossible for a retail trader), but reaction: identifying when a currency becomes statistically stretched relative to its own recent behavior.


!["Smart Money Concepts (SMC) [Iridio Capital]" logo](https://cdn.ctrader.com/image/webp/28b69fd1-ef54-4bed-9487-07e78e883be4_40934)


