Q Trading Sessions
Indicator
324 downloads
Version 2.0, Mar 2026
Windows, Mac
5.0
Reviews: 3
Description
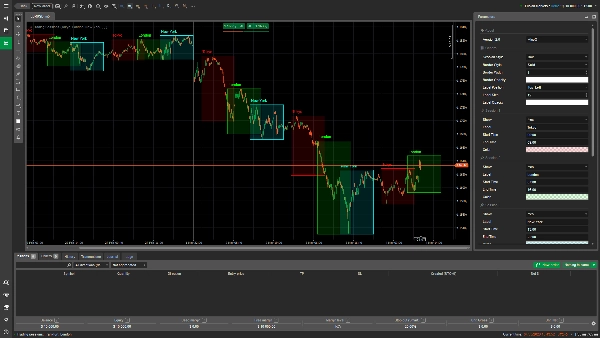
Q Trading Sessions is a visual indicator designed to help traders identify and track market activity across different trading sessions.
✨ Features:
- Up to 6 configurable trading sessions.
- Custom start and end times.
- Optional session labels.
- Individual color settings per session.
- Lightweight and non-intrusive.
---
AlgoQ
Clarity • Simplicity • Stability
Summary
AI summary
Q Trading Sessions is a visual indicator designed to assist traders in identifying and tracking market activity across multiple trading sessions. It supports up to six configurable sessions, each with customizable start and end times. Users can assign optional labels and set individual colors for each session to enhance clarity. The indicator is lightweight and designed to be non-intrusive, making it suitable for various markets including Forex, indices, commodities, stocks, and cryptocurrencies. It helps traders visually segment trading periods on their charts, facilitating better analysis of market behavior during different global trading hours.
Indicator profile
Customer reviews
5.0
Reviews: 3
5 | 100 % | |
4 | 0 % | |
3 | 0 % | |
2 | 0 % | |
1 | 0 % |
Customer reviews
March 10, 2026
Q Trading Sessions is a clean and lightweight session visualization tool for cTrader. It allows traders to highlight up to six custom trading sessions directly on the chart with adjustable colors and optional labels. Perfect for intraday traders who want to track market activity during Asia, London, and New York sessions. Simple, efficient, and easy to configure.
February 22, 2026
QTS is really smooth on the chart and doesn't lag, though it is visible on +15 days.
February 22, 2026
Discussion
FAQ
BTCUSD
Forex
Indices
EURUSD
Commodities
GBPUSD
NZDUSD
Prop
Crypto
Stocks
XAUUSD
NAS100
USDJPY
Products available through cTrader Store, including trading bots, indicators and plugins, are provided by third-party developers and made available for informational and technical access purposes only. cTrader Store is not a broker and does not provide investment advice, personal recommendations or any guarantee of future performance.


!["[Stellar Strategies] MARSI Signal Plotter" logo](https://cdn.ctrader.com/image/webp/7b2b8da6-8f8e-4646-8d4a-4710c516c01e_25567)


Price
324
Free installs