
Swing Points with Fibonacci Suite
Indicator
Version 1.1, Feb 2026
Windows, Mac
Trading product for Swing Points with Fibonacci Suite Indicator Fibonacci, image 2
Trading product for Swing Points with Fibonacci Suite Indicator Fibonacci, image 3
Trading product for Swing Points with Fibonacci Suite Indicator Fibonacci, image 4
Trading product for Swing Points with Fibonacci Suite Indicator Fibonacci, image 5
Trading product for Swing Points with Fibonacci Suite Indicator Fibonacci, image 6
Trading product for Swing Points with Fibonacci Suite Indicator Fibonacci, image 7
Trading product for Swing Points with Fibonacci Suite Indicator Fibonacci, image 8
Trading product for Swing Points with Fibonacci Suite Indicator Fibonacci, image 9
Trading product for Swing Points with Fibonacci Suite Indicator Fibonacci, image 10
Trading product for Swing Points with Fibonacci Suite Indicator Fibonacci, image 11
Since 28/01/2026
2
Sales

Description

WHAT IT DOES

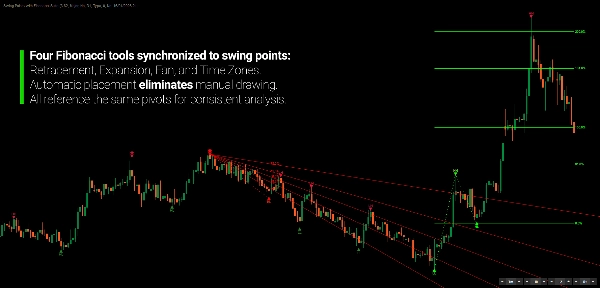
Auto-draw four Fibonacci tools from unified swing detection—eliminating subjectivity and maintaining internal consistency across retracement, expansion, fan, and time zones.

Manual Fibonacci drawing is powerful but subjective. Different traders draw different levels on the same chart. Automated Fibonacci tools typically offer one analysis type — retracement OR expansion OR fan — forcing you to add multiple indicators or draw the rest manually.

This indicator integrates four Fibonacci tools into a single system.

Retracement, Expansion, Fan, and Time Zones are calculated automatically from the same swing detection logic. When a new structural pivot forms, all four tools update in real-time, anchored to the same swing points. No manual drawing. No interpretation variance. No switching between tools.

The result is comprehensive Fibonacci analysis that maintains internal consistency.


WHY AUTOMATED FIBONACCI MATTERS

Fibonacci analysis is widely used because it reflects how markets naturally retrace and extend. The golden ratio appears consistently in price structure, making Fibonacci levels valuable reference points for support, resistance, and projection targets.

The Problem

Manual Fibonacci analysis introduces three practical challenges:

  • Subjectivity — Different traders select different swing points
  • Time consumption — Drawing four tools across multiple timeframes requires significant chart work
  • Inconsistency — Retracement from swing A-B, expansion from B-C, fan from C-D creates disconnected analysis

In practice, automated Fibonacci tools often solve the time issue, but still rely on disconnected swing logic. They'll draw retracements automatically, but you're still manually placing expansion and fan tools from different swings.

The Solution

This indicator applies all four Fibonacci tools to a single, shared swing model. When the algorithm identifies swing points A, B, and C:

  • Retracement draws from the most recent swing pair
  • Expansion projects based on three-swing structure
  • Fan radiates from the anchor swing
  • Time Zones mark intervals forward from the base swing

Each tool references the same structural pivots, keeping the entire analysis internally coherent across all Fibonacci views.


THE CORE CONCEPT

Swing Detection

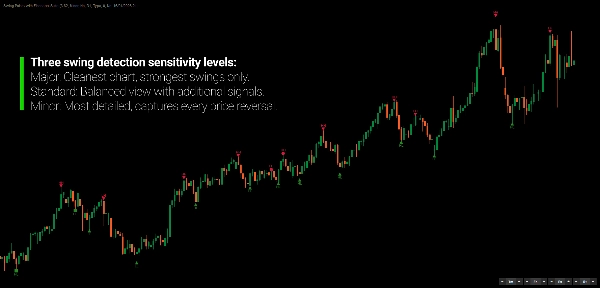
The indicator uses regression method to smooth price action and identify structural pivot points. Unlike simple price extremes or indicator crossovers, regression produces pivots that reflect genuine trend changes instead of momentary volatility.

Three detection modes control sensitivity:

  • Major — Strictest filter, identifies only primary market structure pivots
  • Standard — Balanced approach for swing trading timeframes
  • Minor — Includes counter-trend swings within larger trends for detailed analysis

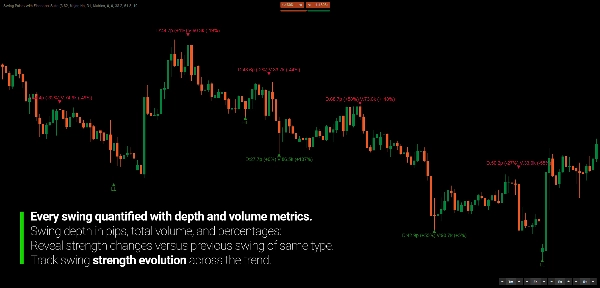
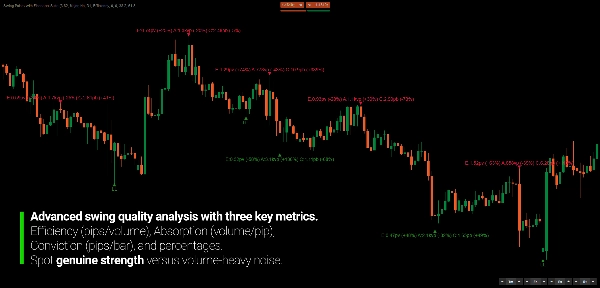
Each swing is classified (HH, HL, LH, LL) and optionally labeled with metrics: depth, volume, duration, efficiency, absorption, and conviction. Comparative percentages show how current swing strength relates to previous swings of the same type.

Fibonacci Integration

Once swings are detected, four Fibonacci tools draw automatically:

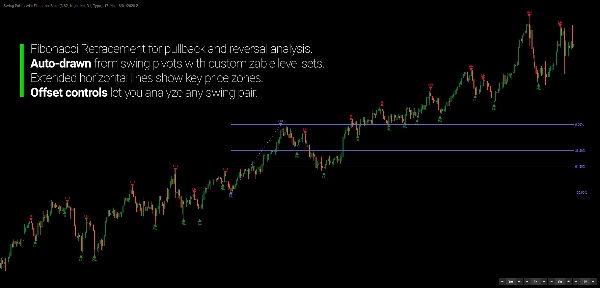
  1. Retracement — Horizontal levels from most recent swing pair
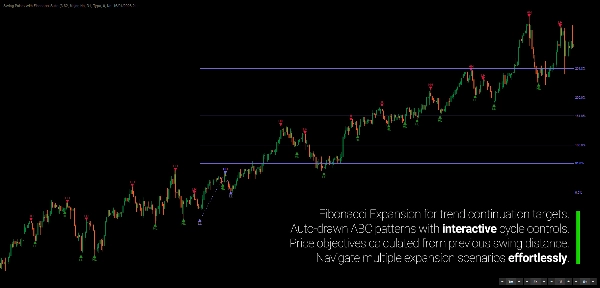
  2. Expansion — Price projections based on ABC structure
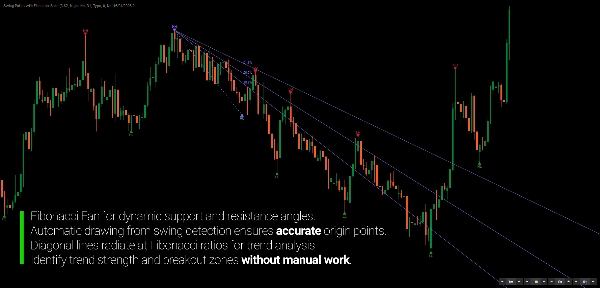
  3. Fan — Diagonal trend channels from anchor point
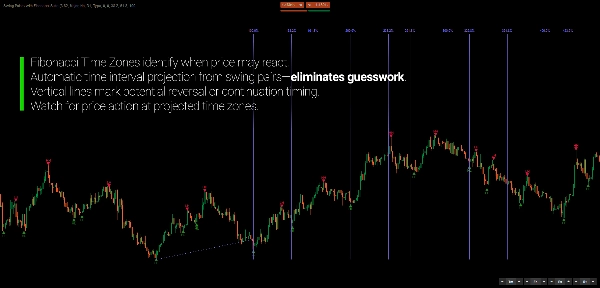
  4. Time Zones — Vertical time projections using Fibonacci intervals

Each tool has independent offset control via on-chart buttons. Adjust which swing pair drives each analysis type without recalculating or redrawing manually.

All four tools can also operate in custom range mode, where you specify exact start/end times instead of using detected swings — useful for analyzing specific market events or sessions.

Multi-Timeframe Context

The indicator can detect swings on a higher timeframe while displaying on your current chart. View Daily swings and their Fibonacci levels on an H1 chart without switching timeframes.

This provides structural context from higher timeframes directly on execution charts, helping align entries with broader market direction.


KEY FEATURES

Swing Detection

  • Regression filtering for structural pivot identification
  • Three detection modes: Major (primary structure), Standard (swing trading), Minor (detailed inner swings)
  • Multi-timeframe capability — detect swings on higher TF, display on lower TF chart
  • Swing classification — HH/HL/LH/LL labels confirm trend structure
  • Three marker types — Triangle (confirmed), Circle (state-only), Square (inner swings)

Fibonacci Tools

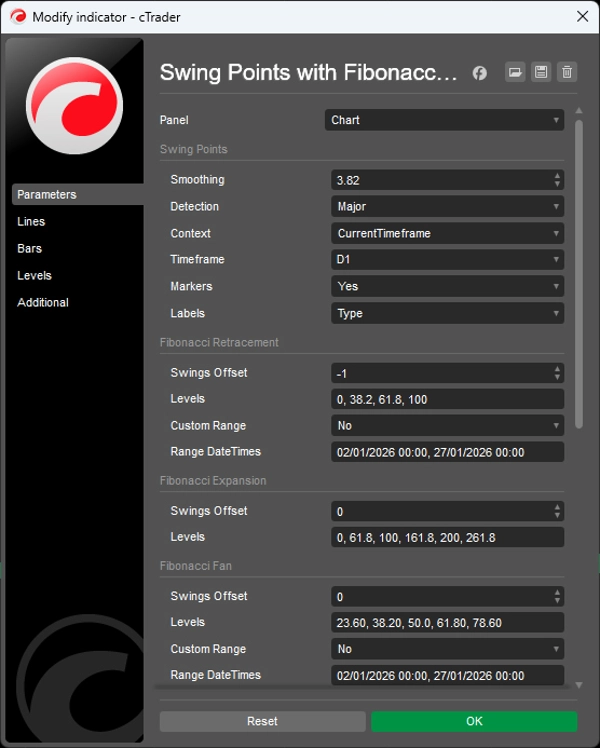
  • Retracement — nine configurable levels (0% to 100%)
  • Expansion — eight projection levels (0% to 261.8%)
  • Fan — five diagonal channels (23.6% to 78.6%)
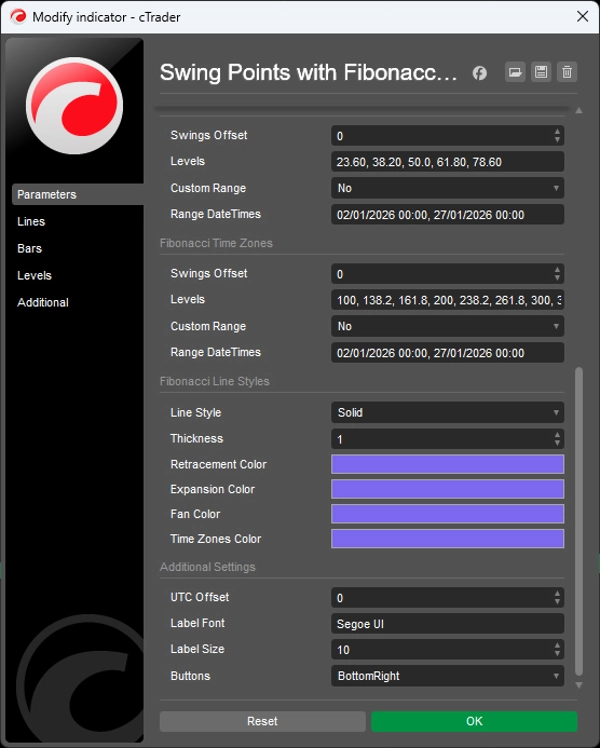
  • Time Zones — nine time intervals (100% to 322.8%)
  • Independent offset controls for each tool via on-chart UI buttons
  • Custom range mode — override swing detection with manual datetime ranges

Swing Metrics

  • Basic metrics — Depth (pips), Volume (tick volume), Duration (bars)
  • Efficiency ratios — Efficiency (pips per volume), Absorption (volume per pip), Conviction (pips per bar)
  • Comparative analysis — percentage change versus previous swing of same type


WHO IT'S FOR

This indicator is designed for traders who use Fibonacci as a structural reference rather than a standalone signal.

If you regularly draw Fibonacci retracements, extensions, or time zones, this tool systematizes that process. Instead of manually placing multiple tools across different swings, the indicator maintains all four simultaneously from the same structural reference points.

It's well suited for swing and position traders who analyze multiple timeframes and want higher-timeframe structure visible on execution charts. Fibonacci-focused traders will benefit from having retracement, expansion, fan, and time analysis unified in a single framework.

Multi-timeframe analysts can display Daily or Weekly swings on intraday charts without switching windows, while technical analysts gain access to swing metrics (efficiency, absorption, conviction) typically requiring manual calculation.

This is not an entry signal system. It is a structural framework for interpreting Fibonacci in market context — reducing manual charting overhead while maintaining the analytical depth that makes Fibonacci tools valuable.


WHAT MAKES IT DIFFERENT

Applying multiple Fibonacci tools usually means working with multiple swing interpretations. Without a unified structural reference, combining retracements, expansions, fans, and time projections can result in disconnected perspectives rather than a coherent framework.

This indicator unifies all four tools under a single swing detection algorithm. Each Fibonacci view is built on the same structural pivots, ensuring that different projections reflect the same underlying market context.

The regression approach filters short-term volatility while preserving structural relevance. Major mode identifies only primary market pivots. Minor mode reveals detailed counter-trend structure within larger swings. The same algorithm, different sensitivity.

Multi-timeframe capability brings higher-timeframe context to execution charts without chart switching. See Daily swings and their complete Fibonacci analysis on an H1 chart — structural context at your trading timeframe.

Independent offset controls allow simultaneous analysis of multiple swing structures. Retracement from the most recent swing while expansion projects from the prior setup. All controlled via on-chart buttons without parameter panel adjustments.


---


UNDERSTANDING FIBONACCI IN MARKET STRUCTURE

Fibonacci ratios appear throughout natural systems, including financial markets. The tendency for retracements to stall near 38.2%, 50%, or 61.8% levels, and for extensions to reach 127.2% or 161.8% projections, reflects underlying market geometry rather than mystical properties.

These levels become self-fulfilling to a degree — enough traders watch them that they influence order flow — but their persistence across timeframes and instruments suggests something more structural.

From a practical standpoint, Fibonacci levels provide objective reference points in otherwise subjective chart analysis. Rather than guessing where support might form in a pullback, Fibonacci retracement gives you specific price zones to monitor.

The challenge isn't whether Fibonacci works — it's maintaining consistency in how you apply it. Manual analysis introduces variance: which swing do you measure from? Do you use wicks or closes? How do you handle overlapping retracements from multiple swing pairs?

Systematic application removes these questions. The algorithm selects swings by the same criteria every time. All four tools reference the same pivots. Analysis becomes replicable and comparable across different market conditions.

This doesn't eliminate discretion — you still decide which swing offset to analyze, which levels matter for your setup, and how to interpret confluence between tools. But it establishes a consistent foundation for that discretion.


---


Trading involves risk. This indicator is a technical analysis tool — always apply proper risk management.

Summary

Indicator profile

Customer reviews

0.0
Reviews: 0
Customer reviews
No reviews for this product yet. Already tried it? Be the first to tell others!

Discussion

FAQ

Fibonacci
Products available through cTrader Store, including trading bots, indicators and plugins, are provided by third-party developers and made available for informational and technical access purposes only. cTrader Store is not a broker and does not provide investment advice, personal recommendations or any guarantee of future performance.

More from this author

Indicator
Supertrend
Adaptive MA anchored to structural trend changes — no fixed period. Dual Supertrend + swing detection.
Indicator
BTCUSD
EURUSD
+5
Noise-filtered Supertrend, swing strength scoring, and S/R zones with polarity tracking. Structure over signals.
Indicator
Fibonacci
Anchor-based Fibonacci channel that grows with the market. Seven display modes, auto-direction, fully draggable.

You may also like

Indicator
Forex
Customizable multi-timeframe pivot point indicator for cTrader with alerts, Fibonacci, CPR, and more!
Indicator
MSS
Market Structure
+2
Smart structural zones with pivot detection, ATR adaptation, sound alerts, and auto-color UI for precise entries.
Indicator
Prop
Forex
+11
🧭 See when your market tends to move—by Month, Day-of-Week, or Hour-of-Day🧭
Indicator
MSS
Key Levels
+4
Maps session ranges, previous highs/lows, equilibrium and premium/discount zones on your cTrader chart.
Indicator
Prop
Forex
+11
Ultimate Session Tool: Boxes, OR, KZs, PD Levels, Overlaps, Custom Lines & Names, Info Panel! Highly customizable 📉📈
Indicator
Signal
Cumulative Volume Delta tracks the net difference in tick volume between buying and selling pressure over time
Indicator
EMA
RSI
+2
Advanced TDI indicator with Shark Fin signals, chart arrows, MTF RSI, divergence detection and smart alerts.
Indicator
Volume
Order Block
+1
Elevate your market analysis with the Aggression Delta Volume Profile, a premium, institutional-grade order flow utility
Indicator
RSI
XAUUSD
+2
Automatic ZigZag swings with dynamic support & resistance levels, labeling highs/lows for clear trend signals.
Indicator
VWAP
Volume
+2
VWAP Stdev Heatmap: Advanced daily VWAP with 5-tier standard deviation bands and dynamic candlestick coloring.
Indicator
ATR
RSI
+5
Advanced Anchored VWAP for cTrader: volatility bands, real‑time alerts & customizable session resets.
Indicator
MACD
Key Levels
+2
Trend indicator with multi-timeframe filters, generating signals only on fully completed bricks & candles. No Repaint.
Indicator
EMA
AI-assisted
+1
Multi EMA Timeframes lets you stay on your chart and see the exact EMA from any timeframe you choose — up to 5 at once.
Indicator
RSI
Breakout
+1
Dynamically adjusts regression channels based on ZigZag extremes, resetting when price breaks bands to track real trends
Indicator
Order Block
Fair Value Gap
+3
This indicator scans multi-timeframe trend confluence and price action triggers within key supply/demand zones
Indicator
Forex
BTCUSD
+10
🎯Smart Signals : Auto Buy/Sell alerts with dynamic TP/SL algorithm. 💡
Indicator
Forex
BTCUSD
+5
Buy-Side & Sell-Side Liquidity (BSL/SSL) Indicator
Indicator
EMA
RSI
+2
Compact premium cTrader dashboard for market bias, sessions, premium/discount context, liquidity direction, ADR range an

Price

Since 28/01/2026
2
Sales























