Description
KST Momentum Heatwave — Turn Momentum Into Market Temperature (On-Chart)
✅ Modern KST engine with optimized defaults (10/15/20/30 + 10/10/10/15, Signal 9)
✅ True price overlay — KST + Signal are projected directly onto the chart around a baseline EMA
✅ 4 Visual Modes: Pro Smooth / Classic / Raw Heat / Two Tier
✅ Momentum Heatmap + Glow to visualize strength instantly
✅ Normalized momentum strength for consistency across symbols and timeframes
✅ Anti-chop hysteresis system to filter noise in sideways markets
This is not a traditional oscillator.
KST Momentum Heatwave transforms the classic Know Sure Thing (KST) indicator into a visual momentum temperature system built directly onto your chart.
Instead of watching an oscillator below the chart, momentum becomes a dynamic layer over price — showing direction, strength, and momentum lifecycle in a way that can be interpreted instantly.
What the indicator does and what it’s designed for
KST Momentum Heatwave converts momentum data into a visual temperature map of market pressure.
Traditional oscillators require traders to constantly switch attention between the price chart and a separate indicator window.
This indicator removes that friction by projecting momentum directly onto the price chart itself.
The result is a cleaner workflow where you can immediately see:
- when momentum is accelerating
- when a trend is strong and dominant
- when momentum is cooling down
- when the market is entering low-energy chop
It is designed for traders who want to quickly identify:
- trend strength
- momentum continuation opportunities
- momentum exhaustion
- regime shifts
Instead of guessing whether a move has power behind it, KST Momentum Heatwave makes that pressure visible.
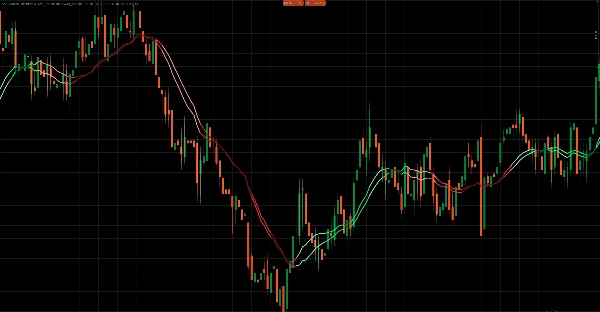
What it plots on the chart and how to read it
The indicator plots two momentum lines directly on the price chart, along with a visual heat layer.
1. KST Line — Momentum Core
The main momentum line calculated from four weighted ROC components.
Interpretation:
- KST above Signal → bullish momentum
- KST below Signal → bearish momentum
The distance between the two lines indicates momentum intensity.
2. Signal Line — Momentum Trigger
A smoothed moving average of the KST line.
It acts as the momentum trigger line.
- Crossovers between KST and Signal often indicate momentum shifts or accelerations.
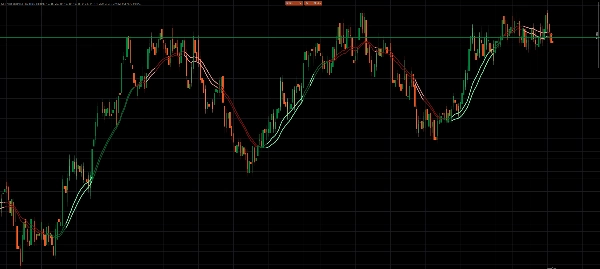
3. Momentum Heat Layer
The indicator converts the distance between KST and Signal into a normalized strength value between 0 and 1.
This value drives the color intensity and heatmap visualization.
Interpretation:
- Bright/light colors → strong momentum
- Normal colors → stable trend pressure
- Dark colors → weakening momentum
- Fading colors → potential slowdown or transition
Optional heatmap and glow effects paint the candles themselves, allowing traders to instantly see when the market is “heating up.”
4. Price Projection Layer
Instead of plotting raw oscillator values, the indicator projects momentum onto price using:
- a baseline EMA
- an ATR-scaled amplitude
This keeps the overlay proportional to the chart and ensures the indicator remains readable across different markets and timeframes.
Visual modes and behavior
KST Momentum Heatwave includes four visual styles that change how momentum is interpreted.
Pro Smooth
The most advanced mode.
Features:
- lifecycle-based momentum coloring
- hysteresis filtering
- confirmation requirements before direction flips
This significantly reduces noise during sideways or choppy markets.
Classic
Uses lifecycle coloring without hysteresis filtering.
Result:
- faster momentum responses
- slightly more sensitive to market fluctuations
Best suited for intraday and swing trading.
Raw Heat
Focuses purely on absolute momentum strength.
Momentum is categorized into three tiers:
- strong
- medium
- weak
This mode is ideal for traders who want a pure momentum power reading.
Two Tier
A simplified interpretation mode.
- KST above/below Signal defines direction
- a strength threshold defines strong vs weak momentum
Designed for traders who prefer minimal visual complexity.
How to use KST Momentum Heatwave
Step 1 — Select your visual mode
Use the mode that matches your trading style:
- Pro Smooth → cleanest signals in noisy markets
- Classic → faster reactions
- Raw Heat → momentum strength focus
- Two Tier → simple strong vs weak interpretation
Step 2 — Identify the momentum regime
Look for dominant color behavior:
- Bullish colors dominating → long bias
- Bearish colors dominating → short bias
- Dark fading colors → momentum weakening
- Frequent color flips → likely ranging conditions
Step 3 — Use momentum for trade timing
Typical use cases include:
Trend continuation
Enter during pullbacks when the momentum regime remains intact and strength stays elevated.
Momentum exhaustion
Reduce exposure when colors fade darker and strength declines.
Momentum reversal
Watch for KST/Signal flips combined with rising strength.
Example recommended setup
A balanced configuration for most markets:
Preset: Swing_Classic
Visual Mode: Pro Smooth
Baseline EMA: 34
ATR Period: 14
ATR Amplitude: 1.40
Normalize Lookback: 200
Heatmap: Enabled
Glow: Enabled
Recommended markets and timeframes
Because the indicator uses ATR scaling and normalized strength, it adapts well to most markets.
Works particularly well on:
Forex
- M5 – H1 for intraday trading
- H1 – H4 for swing trading
Indices
- M1 – M15 for momentum scalping
- M15 – H1 for structured trend trading
Crypto
- M5 – H1 (Pro Smooth recommended)
- H1 – H4 for trend environments
Commodities
- M15 – H4
Lower timeframes benefit most from Pro Smooth filtering.
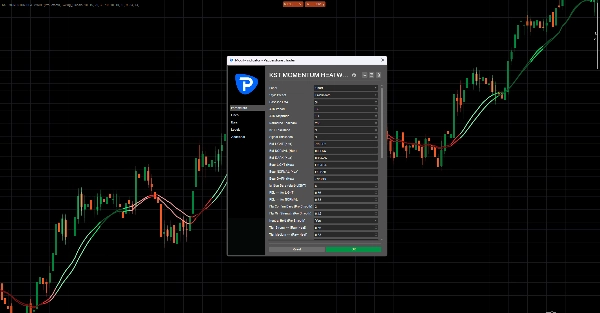
Key parameters and what they control
Preset system
Scalp_Clean, Swing_Classic, Smooth, and Aggressive presets adjust the internal KST configuration.
Custom mode allows full manual control.
Momentum normalization
Normalize Lookback
Controls the historical window used to scale momentum strength.
Higher values produce smoother readings.
Overlay projection
Baseline EMA
Defines the anchor line used to project the momentum overlay.
ATR Amplitude
Controls how far the overlay expands from the baseline.
Anti-chop controls (Pro Smooth)
Flip Confirm Bars
Number of bars required to confirm a regime change.
Flip Min Strength
Minimum momentum strength required before accepting a flip.
Neutral Hold
Helps stabilize the regime during weak momentum conditions.
Heat and glow visualization
Controls how strongly the heatmap reacts to momentum strength.
Parameters include:
- Heat Width
- Heat Alpha
- Heat Gamma
- Glow Strength
Performance management
Keep Bars
Limits how many visual objects remain on the chart to keep the indicator running smoothly.
Important notes
Chart object intensity
Heatmap and glow effects draw multiple objects.
If performance slows:
- reduce KeepBars
- reduce Heat Width
- disable Glow
Strength saturation
Extreme volatility spikes may push strength close to its maximum quickly.
If this occurs:
- increase Normalize Lookback
- switch to Pro Smooth mode
Best used with structure
KST Momentum Heatwave is designed as a momentum regime layer, not a standalone entry generator.
For best results combine it with:
- support and resistance
- market structure
- liquidity zones
- trend analysis


