"Htfbiaspanel" logo
Indicator
Version 1.0, Apr 2026
Windows, Mac
5.0
Reviews: 1
"Htfbiaspanel" uploaded image
Since 07/10/2025
1
Sales

━━━━━━━━━━━━━━━━━━━━━━━━━━━━━━━━━━━━━━━━

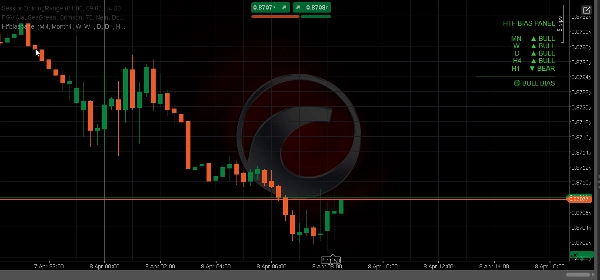
HTF Bias Panel — Bias

━━━━━━━━━━━━━━━━━━━━━━━━━━━━━━━━━━━━━━━━


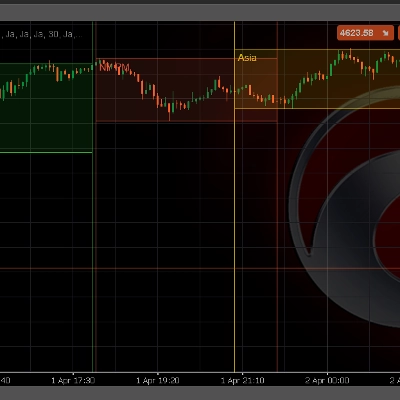
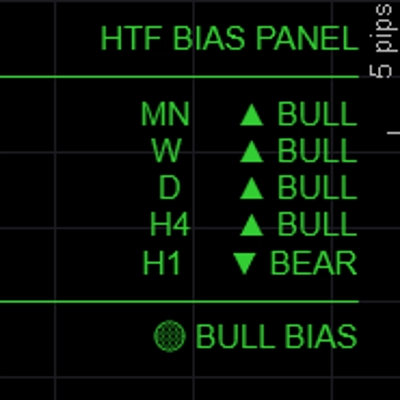
Shows the directional bias for up to five timeframes simultaneously in a clean on-chart panel — so you always know whether the higher timeframes are bullish, bearish, or mixed before entering a trade.


─────────────────────────────

KEY FEATURES


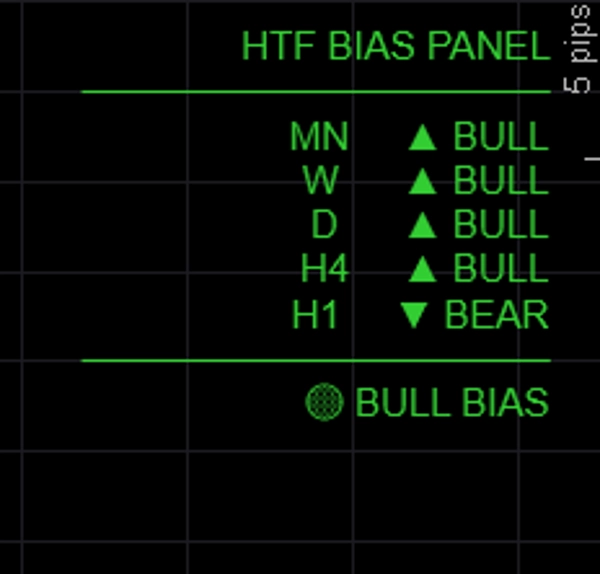
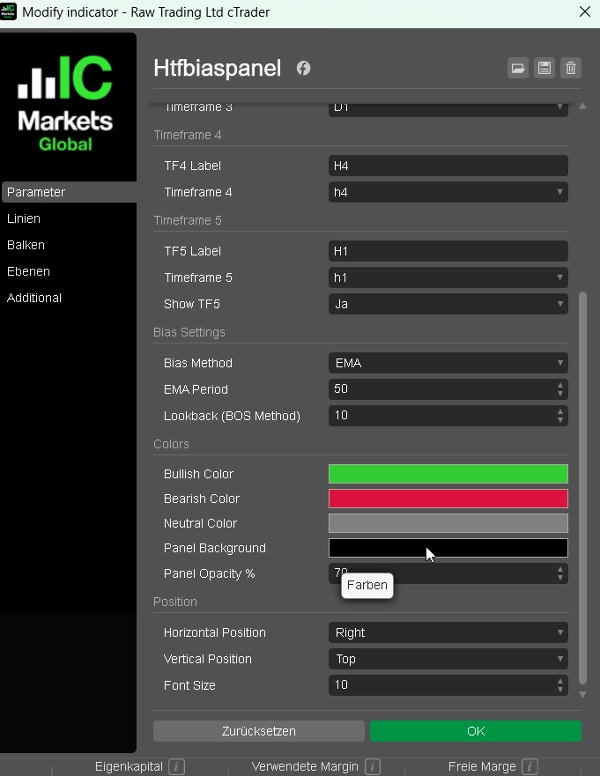
► 5 fully configurable timeframes — default MN / W / D / H4 / H1, all labels and TFs customizable

► Three bias methods — choose how bias is determined per session:

• EMA: close above/below EMA(50) → most reliable for trend following

• Price vs Last Close: current close vs previous close → reactive, momentum-based

• BOS: recent range vs prior range → structure-based bias

► Alignment summary — FULL BULL / FULL BEAR / BULL BIAS / BEAR BIAS / NEUTRAL shown at bottom of panel

► Color-coded output — green for bullish, red for bearish, gray for neutral

► Panel position — place top-left, top-right, top-center, bottom-left, or bottom-right

► Fully customizable colors for bullish, bearish, and neutral states

► Lightweight — no chart drawings, no rectangles, no overhead


─────────────────────────────

BIAS METHODS EXPLAINED


→ EMA (default): Bullish if close > EMA(period). Most stable, ignores short-term noise.

→ Price vs Last Close: Bullish if current bar close > previous bar close. Fast and reactive.

→ BOS: Compares recent N-bar range to prior N-bar range. Bullish if higher highs and higher lows.


─────────────────────────────

DEFAULT SETTINGS


→ TF1 Monthly (MN)

→ TF2 Weekly (W)

→ TF3 Daily (D)

→ TF4 H4

→ TF5 H1 (toggleable)

→ Bias Method EMA

→ EMA Period 50

→ Bull Color LimeGreen

→ Bear Color Crimson

→ Position Top Left


─────────────────────────────

HOW TO USE


1. Add the panel to any chart

2. Choose your preferred bias method (EMA recommended for beginners)

3. Check the alignment summary before entering a trade — only take longs when BULL BIAS or FULL BULL

4. Use HTF bias to filter signals from your BOS/CHoCH or FVG indicator — only trade in the direction confirmed by the panel

5. Adjust timeframes to match your trading style (e.g. D / H4 / H1 / M15 / M5 for scalpers)


─────────────────────────────

IDEAL FOR


✔ ICT and Smart Money Concepts traders needing quick top-down analysis

✔ Multi-timeframe traders who want a fast visual bias check

✔ FTMO and prop firm traders who need to trade with confluence

✔ Any trader who wants to avoid trading against the higher timeframe trend

✔ Forex, Gold, Indices, and Crypto CFD traders


─────────────────────────────

COMPATIBILITY


→ Platform cTrader (Desktop & Web)

→ Asset classes Forex, Indices, Commodities, Crypto CFDs

→ Timeframes All (M1 to MN)

→ Access Rights None required

→ Account type Live & Demo


━━━━━━━━━━━━━━━━━━━━━━━━━━━━━━━━━━━━━━━━


Indicator profile
Indicator category
Market structure (SMC)
Output type
Visualisation
Filter
Data requirements
Bars only
Volume
Supported signals
Session opening range
Breakout
Trend strength
Reversal
5.0
Reviews: 1
5
100 %
4
0 %
3
0 %
2
0 %
1
0 %
Customer reviews
April 19, 2026
HTF Bias Panel is a clean and highly practical tool for multi-timeframe analysis. It quickly shows directional bias across up to five timeframes, helping traders stay aligned with the bigger picture. With multiple bias methods and a clear alignment summary, it’s an excellent filter to avoid trading against higher timeframe trends. Simple, fast, and very effective.
BTCUSD
Forex
Indices
EURUSD
Commodities
GBPUSD
NZDUSD
Prop
Fair Value Gap
SMC
Crypto
XAUUSD
NAS100
USDJPY
Products available through cTrader Store, including trading bots, indicators and plugins, are provided by third-party developers and made available for informational and technical access purposes only. cTrader Store is not a broker and does not provide investment advice, personal recommendations or any guarantee of future performance.

More from this author

Indicator
SMC
Prop
+6
Automatically draws the Opening Range (High & Low) for Tokyo, London, and New York sessions. Configurable start times,
Indicator
SMC
Prop
+12
Killzone, ICT, SMC, Session, Asia, London, New York, NY PM, Session High, Session Low, Smart Money, Order Flow, Trading
Indicator
ATR
SMC
+12
ATR-based SL and TP1/2/3 levels with pip labels and R-multiples. Essential risk tool for FTMO and prop firm traders.

You may also like

Indicator
VWAP
Volume
+5
The MA Quant Volume Profile Custom Range is a trading indicator that analyzes volume distribution across the price.
Indicator
🎯 Order Block Detector - Smart Trading: Identifica bloques de órdenes clave en cTrader para un trading más inteligente.
Indicator
RSI
Grid
+16
SectorIndex Dual Moving Average Indicator: Your Market Compass 🧭
Indicator
Forex
Crypto
+2
A powerful cTrader indicator with customizable Moving Average alerts, notifications, and automated trading actions.
Indicator
XAUUSD
Commodities
Draws support and resistance on all pairs. https://ctrader.com/products/748?u=SuperRay
Indicator
This indicator is an essential tool for traders seeking to visualize key trading sessions on their charts.
Indicator
ATR
Volume
+2
Heatmap Liquidity Zones Visualize volume-at-price, uncover hidden support/resistance, and track market liquidity in real
Indicator
EMA
VWAP
+2
ORB Range Indicator maps the opening range and gives a practical session-breakout workflow with clear labels.
Indicator
Volume
Key Levels
+2
Volume Profile Pro - A Highly Customizable and Lightweight Volume Profile
Indicator
VWAP
Moving Average
Vwap Bands it is highly sought after by professional traders because it includes Standard Deviation Bands
Indicator
Volume
Key Levels
+4
Session & Kill Zone Highlighter - Visual tool for London, NY, Tokyo, Sydney sessions plus ICT Kill Zones.
Indicator
Prop
Forex
+12
A clean, real-time risk HUD designed to prevent prop firm account failure and protect your challenge account.
Indicator
Customizable window inside your platform, access to any website Calendar
Indicator
RSI
EURUSD
+2
It identifies areas of market imbalance (Fair Value Gaps or FVGs) and projects them on the chart in a smart way
Indicator
Prop
Forex
+13
Color Volume Bars – Visualize Market Strength Instantly
Indicator
Signal
USDJPY
See USD demand in one line—Composite OBV fuses six major FX pairs into a clear momentum gauge.
Indicator
VWAP
Volume
+2
VWAP Bands and Swing Wick Structure Indicator
Indicator
ATR
SMC
+20
Smart ICT Concepts indicator from TV: combining FVGs, Liquidity, Order Blocks, and Market Structure in one tool.
Since 07/10/2025
1
Sales