Description
📊 Trading Pro Market
https://chartshots.spotware.com/c/69f0ec41d4cfc
Trend channel + price forecast + automatic support & resistance zones — all in one overlay indicator
🔍 What is it?
https://chartshots.spotware.com/c/69f0ec1fa9930
Trading Pro Market is an advanced technical analysis indicator that combines three independent engines into a single tool: a trend channel with forward projection, a price forecast system based on historical movement patterns, and an automatic support & resistance zone detector. Everything renders directly on the price chart — no separate panel needed.
📐 Module 1 →ICP Channel🔮 Module 2 → MFP Forecast 🧲 Module 3 → S/R Zones
https://chartshots.spotware.com/c/69f0ec8faa957
📐 Module 1 — Trend channel (ICP)
⚙️ How does it detect the trend?
The indicator splits the visible bars into time blocks (default: 30 bars per block, 6 blocks total). Inside each block it calculates the geometric midpoint between the highest high and the lowest low using a logarithmic price scale. It then connects those midpoints across blocks to determine whether price is trending up, down, or moving sideways.
The slope of that connecting line is converted into an angle expressed in degrees. If the angle falls below the configured threshold (default 0.3°), the market is classified as ranging. Above that threshold, the indicator assigns a bullish or bearish direction.
💡 Volatility is measured using the Yang-Zhang estimator — a statistical formula that uses open, close, high, and low prices to calculate the true market volatility. This number normalizes the angles so the channel behaves consistently across any asset or timeframe.
🎨 What does it draw on the chart?
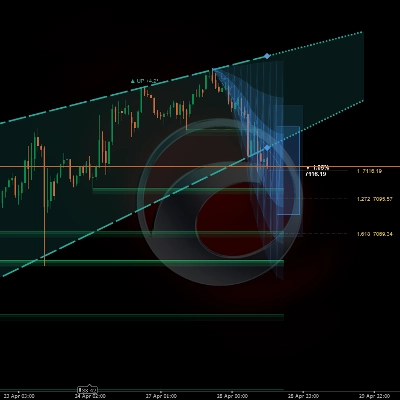
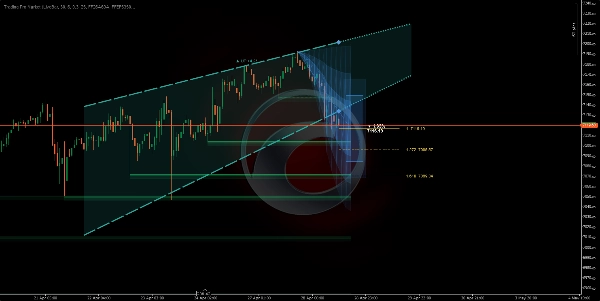
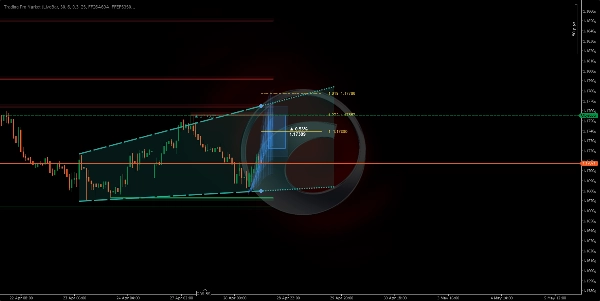
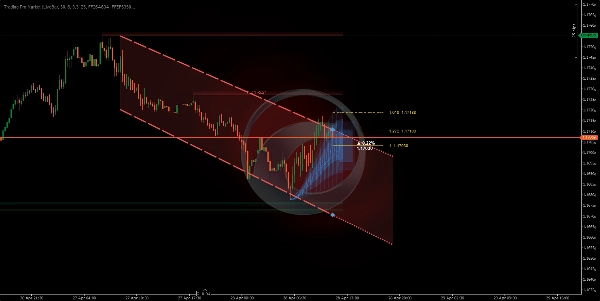
It plots two lines forming the channel (ceiling and floor), with a shaded fill zone between them. To the right, the channel extends as a dotted projection following the current slope. Colors change automatically based on direction:
🟢 Green — bullish trend🔴 Red — bearish trend⬜ Gray — ranging market
🔁 State machine — where is price inside the channel?
The indicator tracks the real-time position of the closing price relative to the channel boundaries and classifies the situation into five distinct states:
🟦 Inside→⚡ Breakout→📏 Distanced→↩️ Retest→✅ Confirmed
Each state is described in plain text on the chart's info panel, along with the percentage distance to the channel ceiling or floor at any given moment.
🔮 Module 2 — Movement forecast (MFP)
⚙️ How does it generate the forecast?
The engine detects significant price pivots (local highs and lows) by looking back a configurable number of bars. Each confirmed pivot records two data points: the percentage of price move completed and the number of bars it took. Up to 20 historical moves are stored, and the expected next move is calculated using one of three methods:
⚖️ Weighted — recent moves carry more weight➕ Simple average — all moves weighted equally📊 Median — outliers are filtered out
🎨 What does it draw on the chart?
Three optional visual elements are projected into the future based on the current pivot origin:
1
🔵 Projection Zone: three layers of decreasing opacity that illustrate the probable range of the move. A wider cone means greater uncertainty based on historical variance.
2
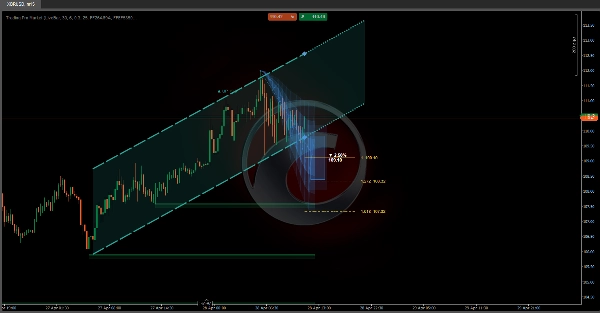
🎯 Target box: a rectangle placed at the estimated destination price, with the expected percentage move and exact price level labeled in text.
3
📏 Fibonacci levels: horizontal lines projected from the origin to the destination using configurable ratios (default: 1.0, 1.272, and 1.618).
⚠️ The forecast does not predict the future. It is a statistical average of past similar moves. Its value lies in setting realistic expectations for magnitude and duration — not as a standalone entry or exit signal.
🧲 Module 3 — Support & resistance zones
⚙️ How does it detect the zones?
Each time a pivot is confirmed, the indicator draws a horizontal zone using the ATR (Average True Range) to determine the zone's thickness. Resistance zones are drawn in red, support zones in green — both with two opacity layers to create visual depth and clarity.
Zones behave dynamically: if price closes on the other side of the zone, it is marked as "broken" — switching to a dotted line with reduced opacity. Zones automatically disappear after the number of bars configured in "Zone Lifespan".
🚀 How to use it
1
Confirm the trend: check the channel color and direction. The angle in degrees tells you how strong the trend is — a steeper angle means more momentum.
2
Read the price state: the info panel on the chart describes whether price is inside, breaking out, or retesting the channel boundary in real time.
3
Evaluate the projection: the cone and target box give a reference for where and how far price could move, based on the historical pattern library built up over the session.
4
Respect the zones: unbroken S/R boxes mark price levels where the market has previously reacted. A zone that hasn't been pierced carries more significance than one already broken through.
🖥️ Compatibility & requirements
✅ cTrader✅ cAlgo API✅ Any asset✅ Any timeframe✅ Price overlay
No internet access or special permissions required. All calculations are performed locally using the price data already available in the platform.
⏱️ For best results, use on timeframes of 15 minutes or higher. On very low timeframes (1–5 minutes) market noise can produce pivots with low statistical reliability, reducing the quality of both the S/R zones and the forecast.
Summary
Customer reviews
5 | 0 % | |
4 | 100 % | |
3 | 0 % | |
2 | 0 % | |
1 | 0 % |


!["[Stellar Strategies] Market Session Ultimate" logo](https://cdn.ctrader.com/image/webp/61ffd537-0125-4246-9e72-42eca1791d64_28232)
