
Description
VoltyBands is an adaptive volatility-based indicator that dynamically tracks price behavior and visualizes market conditions through responsive upper and lower bands. Unlike static channel indicators, VoltyBands adjusts in real time to reflect shifts in volatility, helping traders better understand price expansion and contraction phases.
By combining adaptive band calculations with an optional smoothed signal line, VoltyBands provides a clear framework for analyzing momentum, identifying potential reversal zones, and spotting consolidation periods.
Key Features
- Adaptive Volatility Bands
Bands automatically expand and contract based on current market activity. - Zero-Centered Mode
Option to display price movement relative to a central baseline for improved clarity. - Normalization Option
Enables consistent scaling, making it easier to compare signals across different instruments and timeframes. - Integrated Moving Average
Built-in smoothing with selectable methods (SMA, EMA, SMMA, LWMA). - Customizable Display
Optional middle line and flexible visualization settings.
How to Use
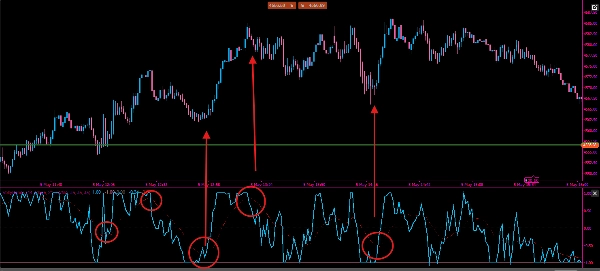
- Momentum Detection
Price moving close to the upper band may indicate bullish strength, while proximity to the lower band suggests bearish pressure. - Reversal Zones
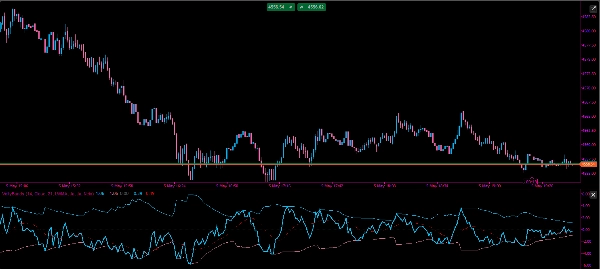
Extreme deviations from the center line can highlight areas where price may revert. - Volatility Analysis
Widening bands indicate increasing volatility; narrowing bands suggest consolidation. - Signal Confirmation
Use the moving average as an additional filter for entries or exits.
Parameters
- Length – Defines sensitivity of volatility calculation
- Source – Input price (Close, Open, etc.)
- MA Period – Period for the smoothing line
- MA Method – Moving average type (SMA, EMA, SMMA, LWMA)
- Show Middle – Toggle the center line
- Zero Bind – Enable zero-based visualization
- Normalize – Activate normalized scaling
Practical Usage
VoltyBands can be used to assess both momentum and market structure in real time. When price remains close to the upper band, it suggests sustained bullish pressure, while consistent interaction with the lower band indicates bearish conditions.
In ranging markets, traders may look for price to move between the bands, using the outer levels as potential areas for mean reversion. In contrast, during strong trends, price may “ride” one side of the band, signaling continuation rather than reversal.
The middle line can serve as a dynamic equilibrium level. Crosses above or below this line may be used as directional cues, especially when combined with the built-in moving average for confirmation.
For normalized mode, values can be interpreted as relative extremes, making it easier to identify overextended conditions regardless of the instrument or timeframe.
As with any indicator, VoltyBands is most effective when used alongside price action and additional confirmation tools.


!["[Stellar Strategies] Market Session Ultimate" logo](https://cdn.ctrader.com/image/webp/61ffd537-0125-4246-9e72-42eca1791d64_28232)
!["Smart Money Concepts (SMC) [Iridio Capital]" logo](https://cdn.ctrader.com/image/webp/28b69fd1-ef54-4bed-9487-07e78e883be4_40934)


