present
Sign up and get $50 off your first purchase
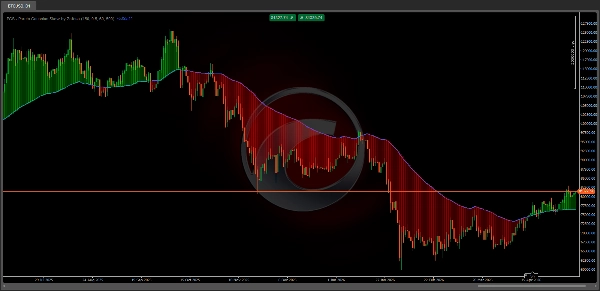
Trading product for PGS - Pareto Gaussian Skew by Zofesu Indicator EMA Supertrend, image 1
PGS - Pareto Gaussian Skew by Zofesu
Indicator
Version 1.0, May 2026
Windows, Mac
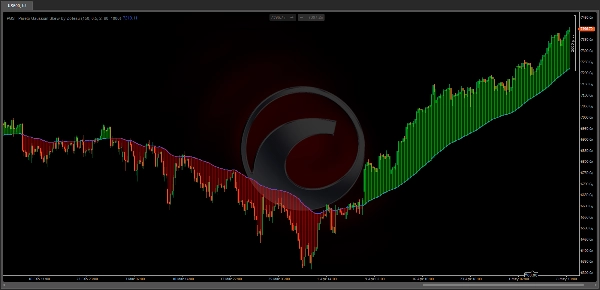
Trading product for PGS - Pareto Gaussian Skew by Zofesu Indicator EMA Supertrend, image 2
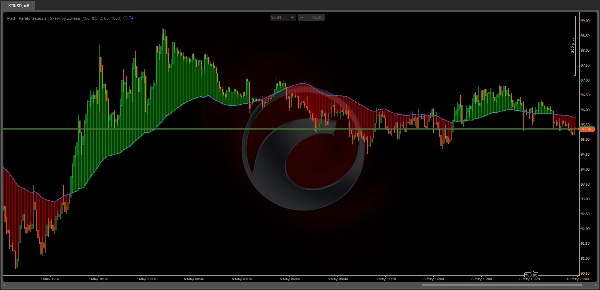
Trading product for PGS - Pareto Gaussian Skew by Zofesu Indicator EMA Supertrend, image 3
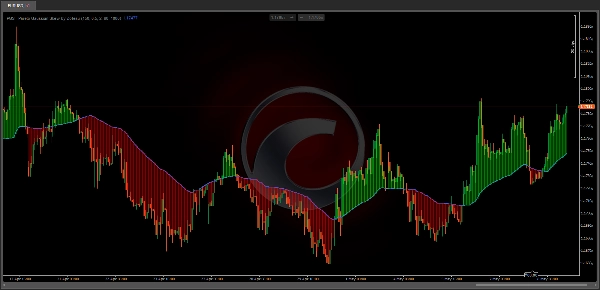
Trading product for PGS - Pareto Gaussian Skew by Zofesu Indicator EMA Supertrend, image 4
Trading product for PGS - Pareto Gaussian Skew by Zofesu Indicator EMA Supertrend, image 5
Trading product for PGS - Pareto Gaussian Skew by Zofesu Indicator EMA Supertrend, image 6
Since 01/12/2025
280
Free installs

Description

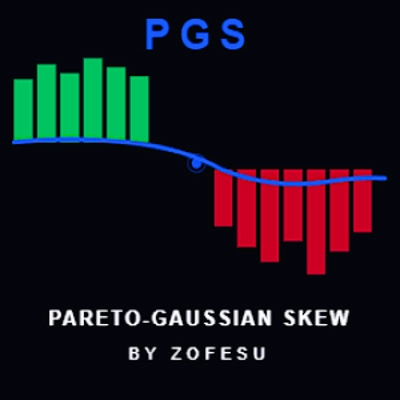
๐Ÿ“Š PGS โ€” Pareto-Gaussian Skew by Zofesu โ€” Institutional Gravity Line & Tension Cloud. PGS is a precision overlay indicator built on two mathematical principles: the Gaussian distribution and the Pareto 80/20 rule. It identifies the invisible gravitational center of price โ€” filtering out noise and focusing only on the 20% of moves that drive 80% of the trend.

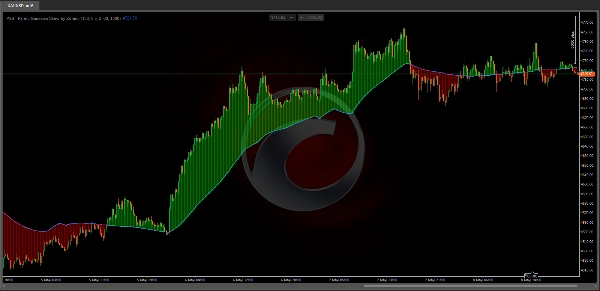
โš™ HOW IT WORKS The indicator calculates a dynamic baseline (SMA) and standard deviation over a configurable lookback window. Only price moves that exceed one standard deviation are considered statistically significant โ€” these represent institutional displacement, not random noise. The Pareto Skew Factor amplifies these extreme moves and feeds them into an EMA smoother, producing a stable gravity line that adapts to market structure. The Tension Cloud fills the space between price and the gravity line: Green cloud (price > PGS line) โ€” price is above gravity, bullish bias Red cloud (price < PGS line) โ€” price is below gravity, bearish bias The wider the cloud, the more extended price is from its statistical center โ€” a potential reversion zone.

๐Ÿ”‘ KEY FEATURES
โœ… Pareto-Gaussian gravity line โ€” filters noise, reacts only to institutional moves
โœ… Dynamic Tension Cloud โ€” visualizes distance between price and gravity center
โœ… Configurable Skew Factor โ€” control sensitivity to extreme price displacement
โœ… Adjustable lookback (Smith's Memory) โ€” 20 to 500 bars
โœ… Custom cloud colors and opacity โ€” full visual control
โœ… Max Cloud Bars limit โ€” performance-optimized rendering
โœ… Lightweight C# โ€” no performance impact

๐Ÿ“š HOW TO USE

  1. Add PGS to any chart and timeframe
  2. Watch the PGS blue line โ€” this is your gravity center
  3. Green cloud = price above gravity โ†’ look for long setups or trend continuation
  4. Red cloud = price below gravity โ†’ look for short setups or trend continuation
  5. Wide cloud = price is extended โ†’ potential mean reversion zone, reduce position size or wait
  6. Price crossing the PGS line = gravity shift โ†’ potential trend change
  7. Use in confluence with S/R levels, VWAP, or volume signals

Works on any TimeFrame and Asset: Indices (NAS100, SPX500), Forex, Gold, Crypto

๐Ÿ”— PARAMETERS

  • Smith's Memory (Lookback) โ€” statistical window for SMA and StdDev calculation (default 150, range 20โ€“500)
  • Pareto Skew Factor โ€” weight of extreme moves in gravity calculation (default 0.5, range 0.1โ€“1.0)
  • PGS line thickness can be adjusted via right-click โ†’ Format on the indicator or Properties โ†’ lines (default 2)
  • Cloud Opacity (0โ€“200) โ€” transparency of the Tension Cloud (default 60, 0=Off)
  • Max Cloud Bars โ€” maximum number of bars rendered for the cloud (default 500)
  • Bull Cloud Color โ€” color when price is above gravity (default green)
  • Bear Cloud Color โ€” color when price is below gravity (default red)

๐Ÿ“ NOTES

  • Higher Skew Factor (0.8โ€“1.0) = gravity line reacts more aggressively to institutional moves
  • Lower Skew Factor (0.1โ€“0.3) = smoother, more conservative gravity line
  • Higher Lookback = slower, macro-level gravity center
  • Lower Lookback = faster, more reactive to recent price action
  • Max Cloud Bars upper limit is 2000. Values above 1000 may impact performance. On lower timeframes (M5 and below) use 300 or less.

โš ๏ธ DISCLAIMER Trading financial instruments involves substantial risk of loss. Past performance of any indicator or strategy does not guarantee future results. This tool is provided for informational and educational purposes only. Always use proper risk management and never risk more than you can afford to lose. The author is not responsible for any trading losses incurred through the use of this indicator.

Summary

Indicator profile
Indicator category
Market structure (SMC)
Output type
Visualisation
Data requirements
Bars only
Supported signals
Trend strength
Level touch
Level break
Reversal

Discussion

Customer reviews

0.0
Reviews: 0
Customer reviews
No reviews for this product yet. Already tried it? Be the first to tell others!

FAQ

EMA
Supertrend
Key Levels
MSS
Volume
Market Structure
VWAP
Products available through cTrader Store, including trading bots, indicators and plugins, are provided by third-party developers and made available for informational and technical access purposes only. cTrader Store is not a broker and does not provide investment advice, personal recommendations or any guarantee of future performance.

More from this author
Indicator
VWAP
Forex
+7
VWAP + Swing Liquidity + SFP Signals โ€” detects liquidity sweeps with color-coded alerts.
Indicator
SMC
Forex
+5
Fear & Greed engine โ€” detects institutional overheating with BB + Percentile signals.

You may also like

Indicator
ZigZag Pro DEMO โ€“ Multi-Swing Indicator for cTrader DEMO VERSION โ€“ 24 hours free trial! This is a DEMO version of the Z
Indicator
ATR
Key Levels
+1
Explore 88 harmonic price-pattern variants with interactive chart controls and geometric reference levels.
Indicator
SMC
Prop
+14
BoS ChoCH Pro,Strict Mode,False Breakout Filter,Average hit rate: 72-78%
Indicator
Pin Bar
Inside Bar
+2
Advanced candlestick pattern recognition with structural quality scoring, alerts and adaptive chart visuals.
Indicator
Prop
VWAP
+5
VWAP is a powerful tool for intraday traders
Indicator
Forex
GBPUSD
+3
Support & resistance zones with measured hold rates and confidence intervals โ€” evidence, not just lines on a chart.
Indicator
AI
ATR
+9
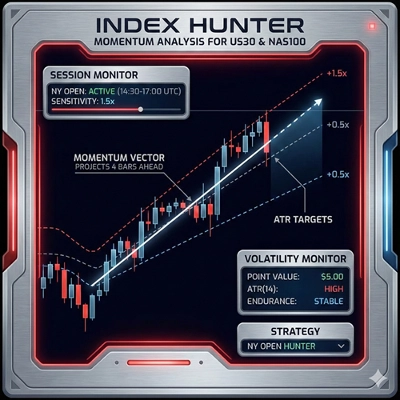
Index Hunter: Momentum analysis for US30 & NAS100. Designed to identify high-velocity moves and intraday trends.
Indicator
Prop
Forex
+13
Supertrend - Multi-Timeframe Indicator
Indicator
Forex
EURUSD
+7
Institutional Session Levels Pro OHLC,Prev(D,W,M OHLC)
Indicator
Key Levels
Support & Resistance
Clean psychological round-number grid with native pip and point auto-scaling across Forex, Gold, Indices, and Crypto.
Indicator
ATR
BOS
+5
Market structure with BOS and CHoCH, order blocks, and retest buy/sell arrows with entry, stop and two targets
Indicator
ATR
RSI
+19
Multi-timeframe heatmap scoring Direction, Strength & Volatility at a glance!
Indicator
ADX
ATR
+5
Multi-indicator confluence HUD & real-time backtest engine to detect trend alignment and filter high-probability setups.
Indicator
ATR
MSS
+5
Advanced market structure and institutional cycle mapper with visual reference cards and entry alerts
Indicator
Signal
This Fair Value Gap (FVG) indicator is a technical analysis on multi-timeframe.
Indicator
AI
ATR
+27
Deep Mood Distribution (DMD) is a segmented volume-profile and sentiment tool that analyzes price action in fixed bar bl
Indicator
Supertrend
Moving Average
Easy Trade: Trend & Breakout Indicator for cTrader
Indicator
Forex
BTCUSD
+6
All-In-One solution for ICT's FVG IFVG ORDERBLOCK in advanced mode.

Price

Since 01/12/2025
280
Free installs