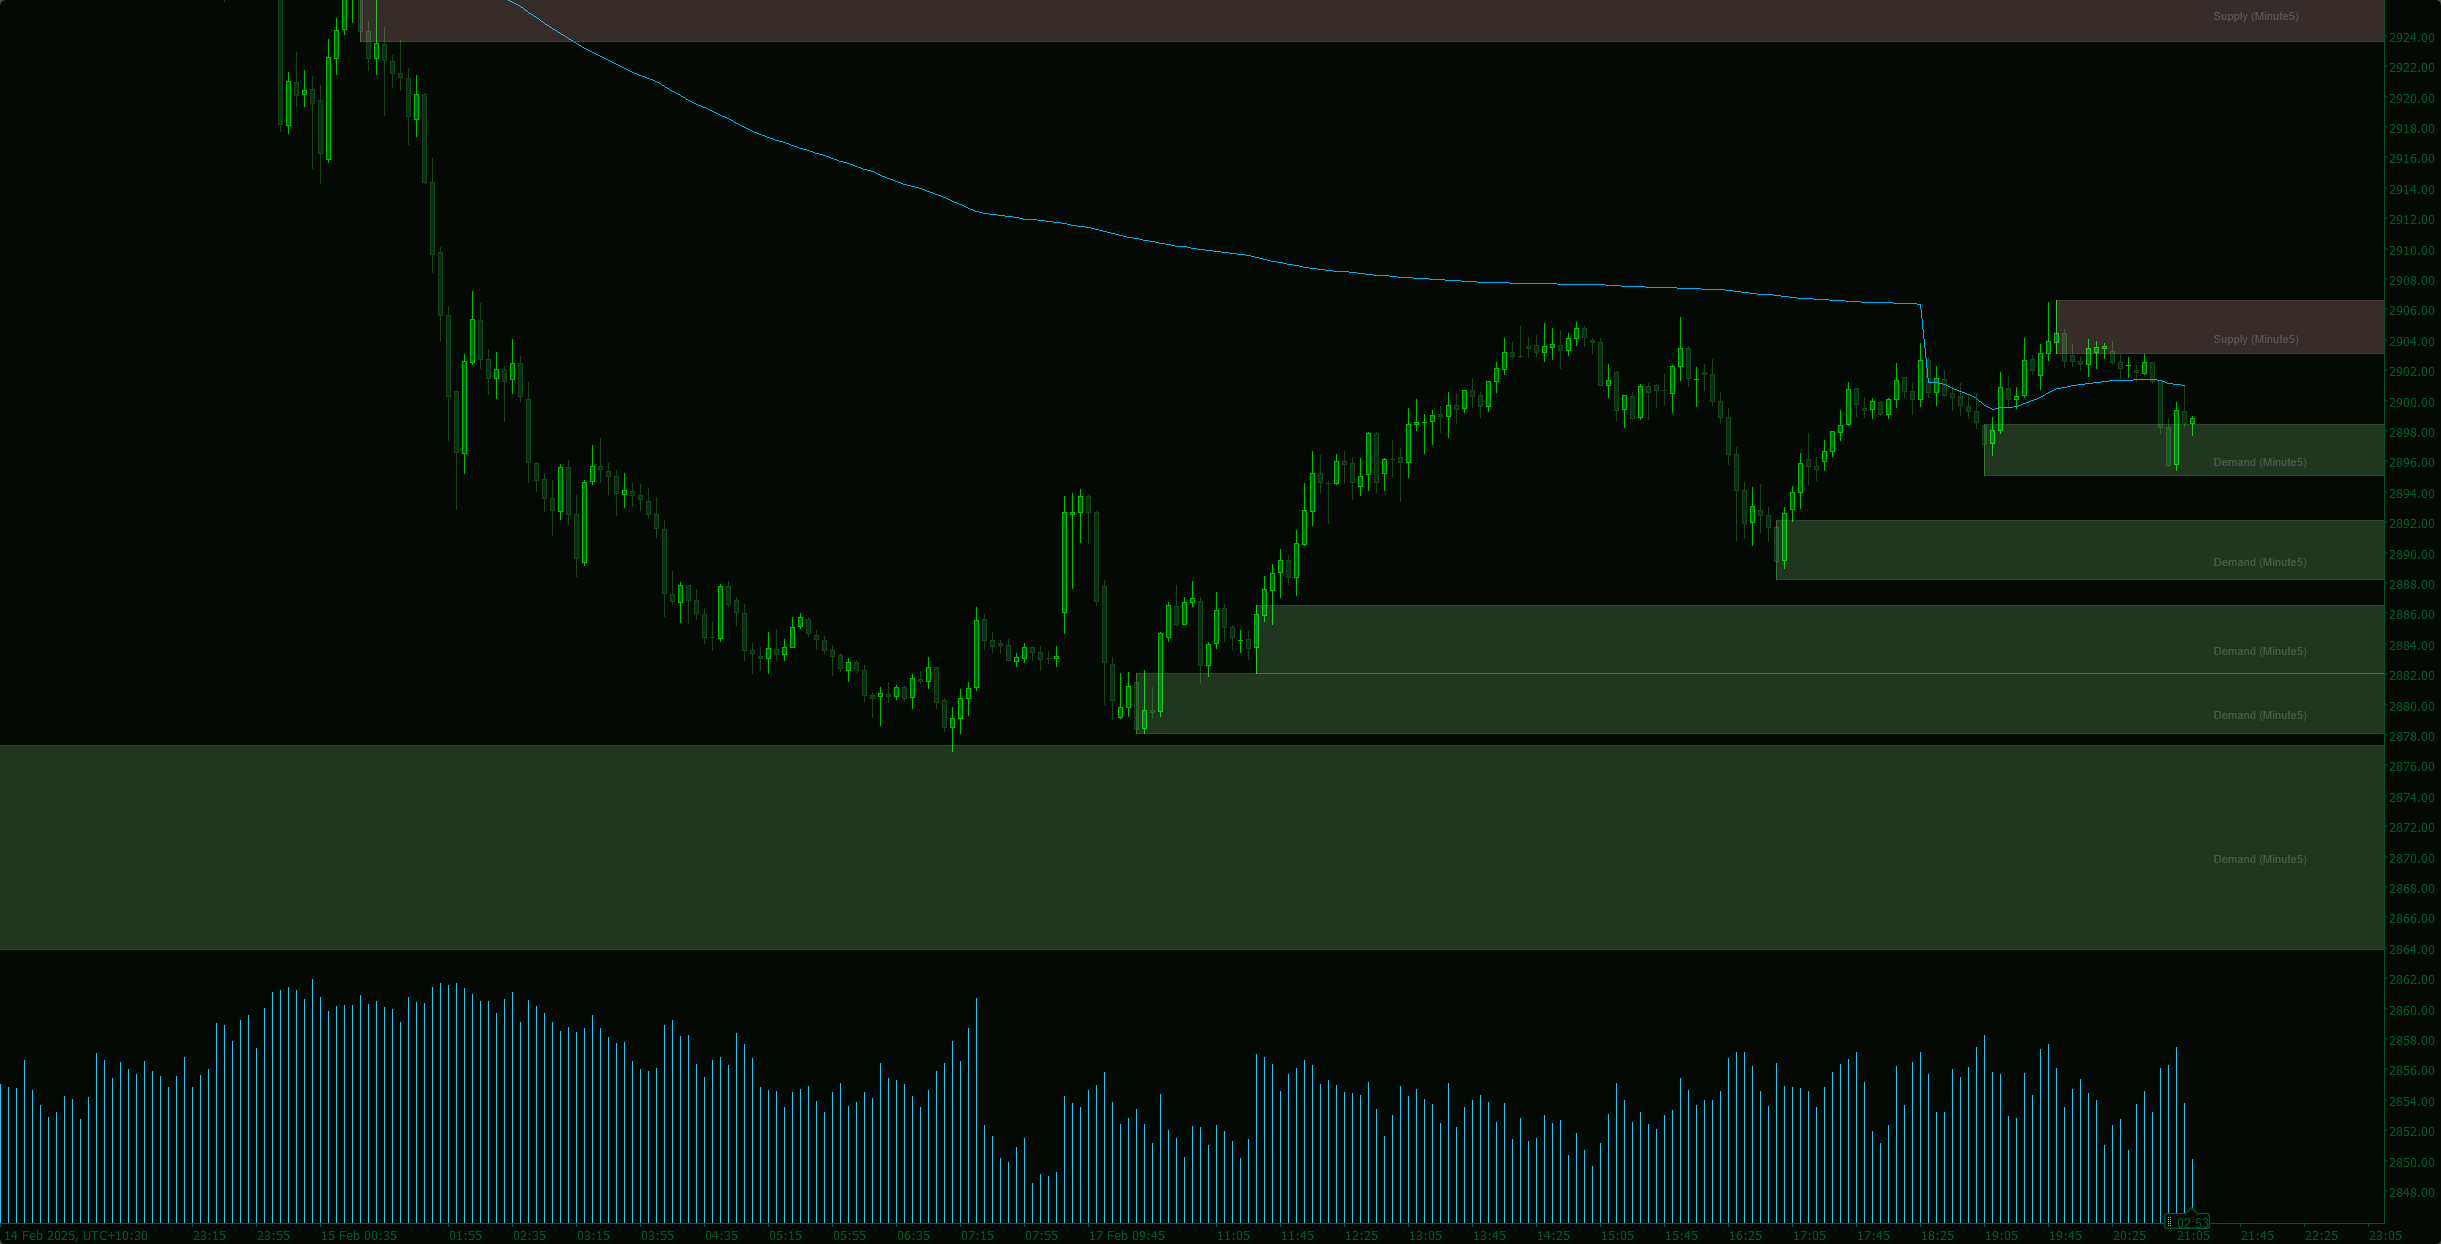
Volume Profile Triple Line - POC Median Mode
Indicator
3 purchases
Version 1.0, Feb 2025
Windows, Mac

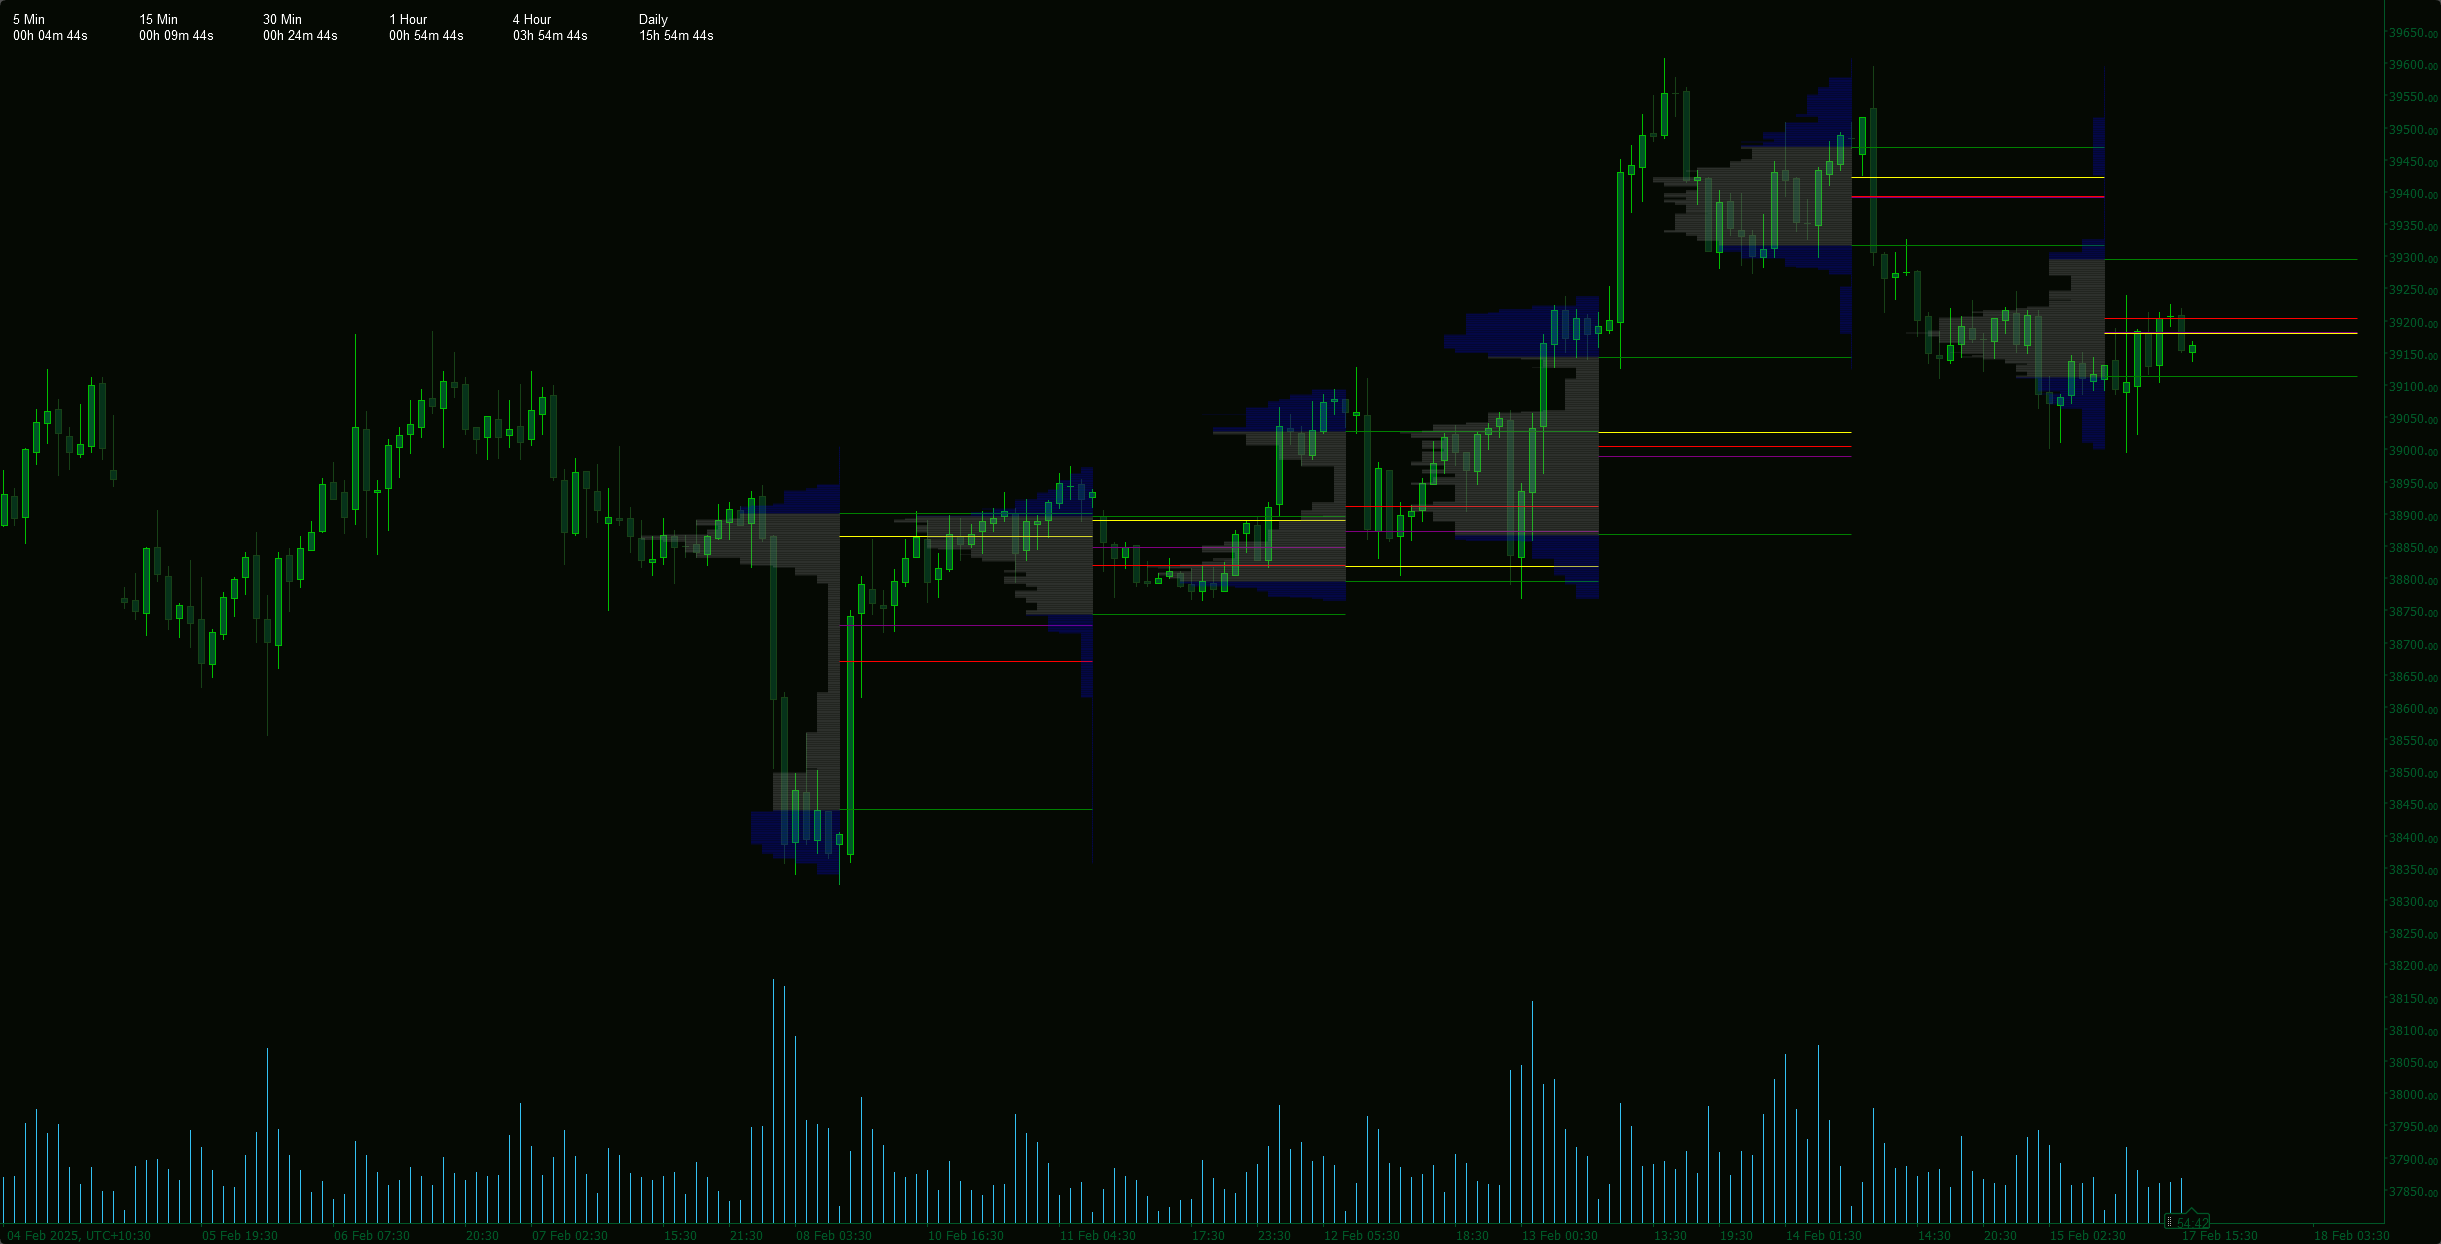
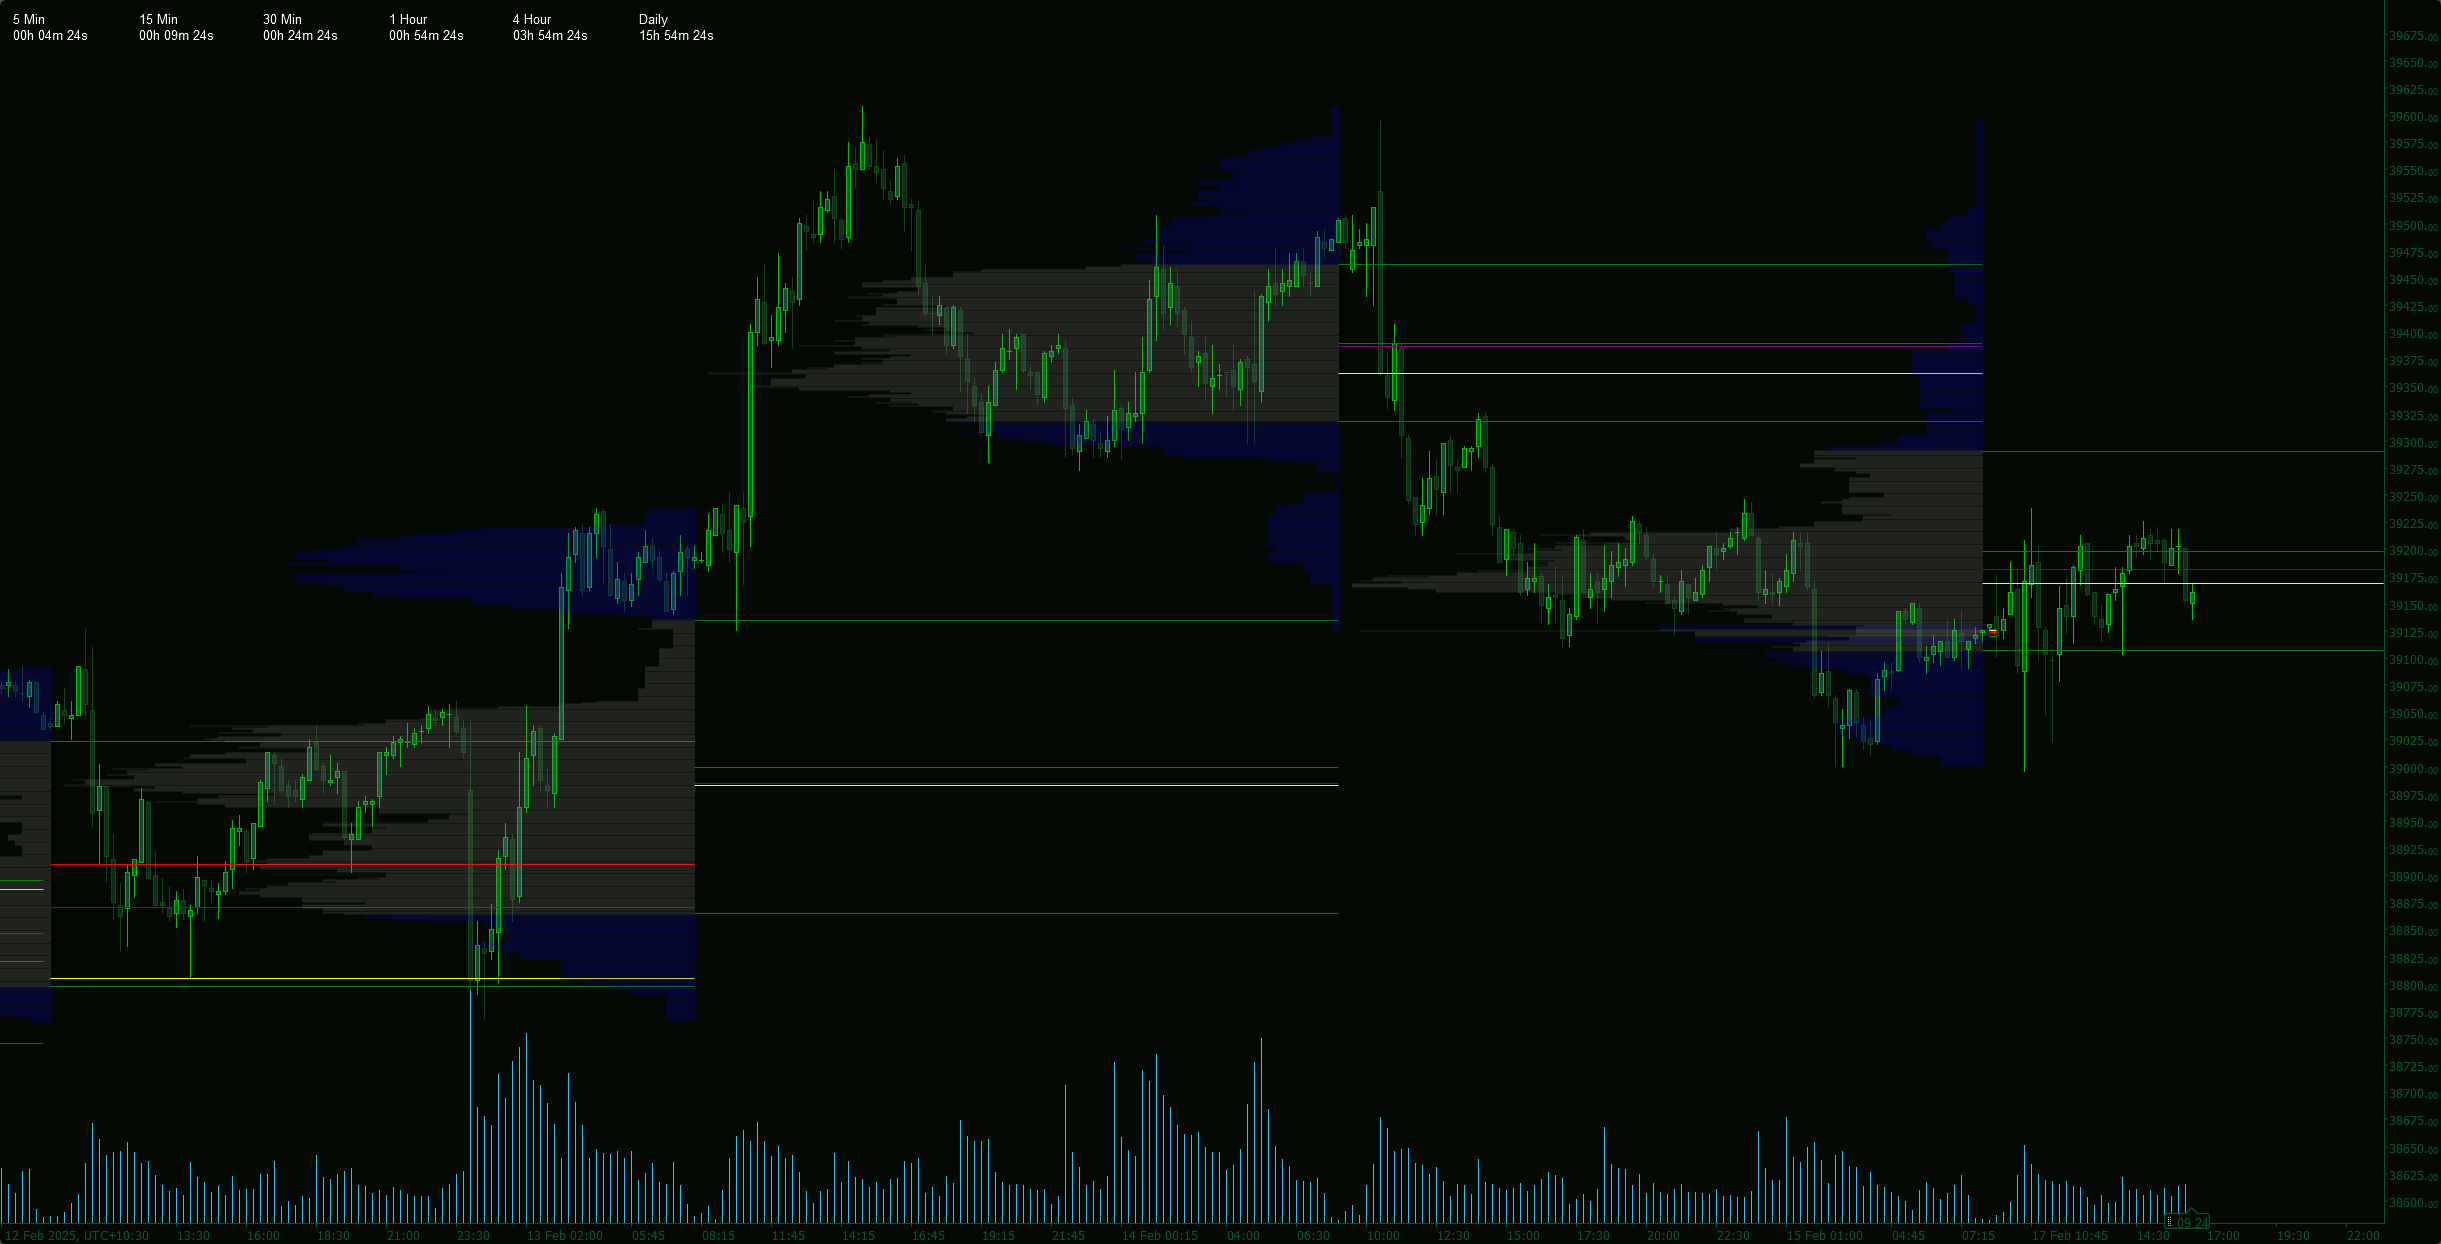
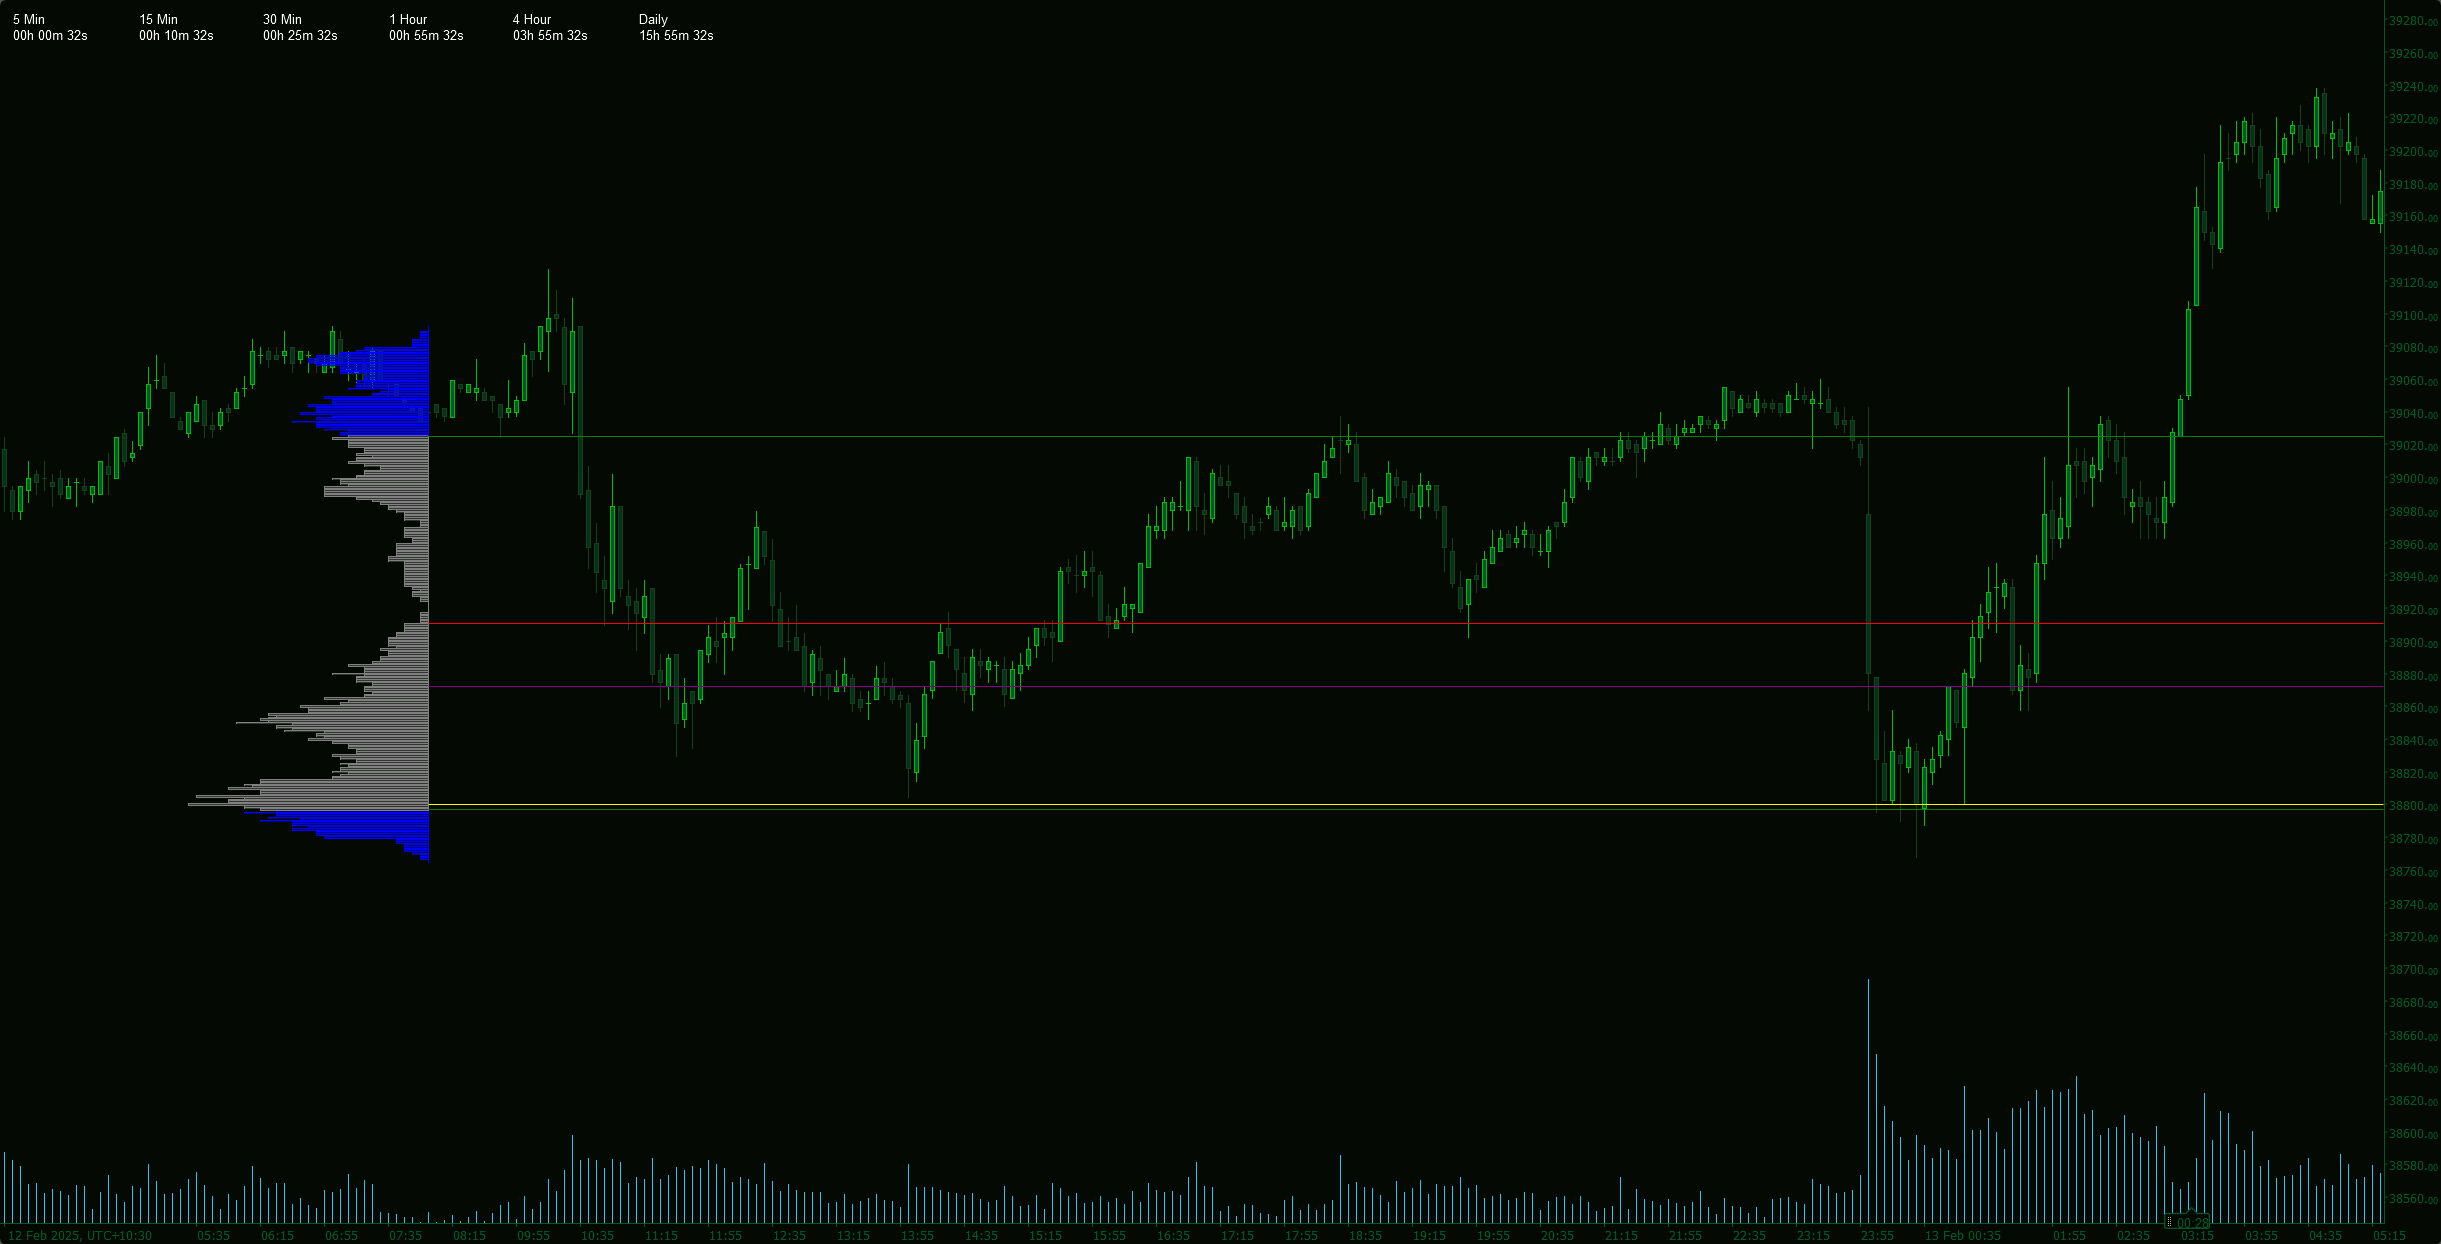
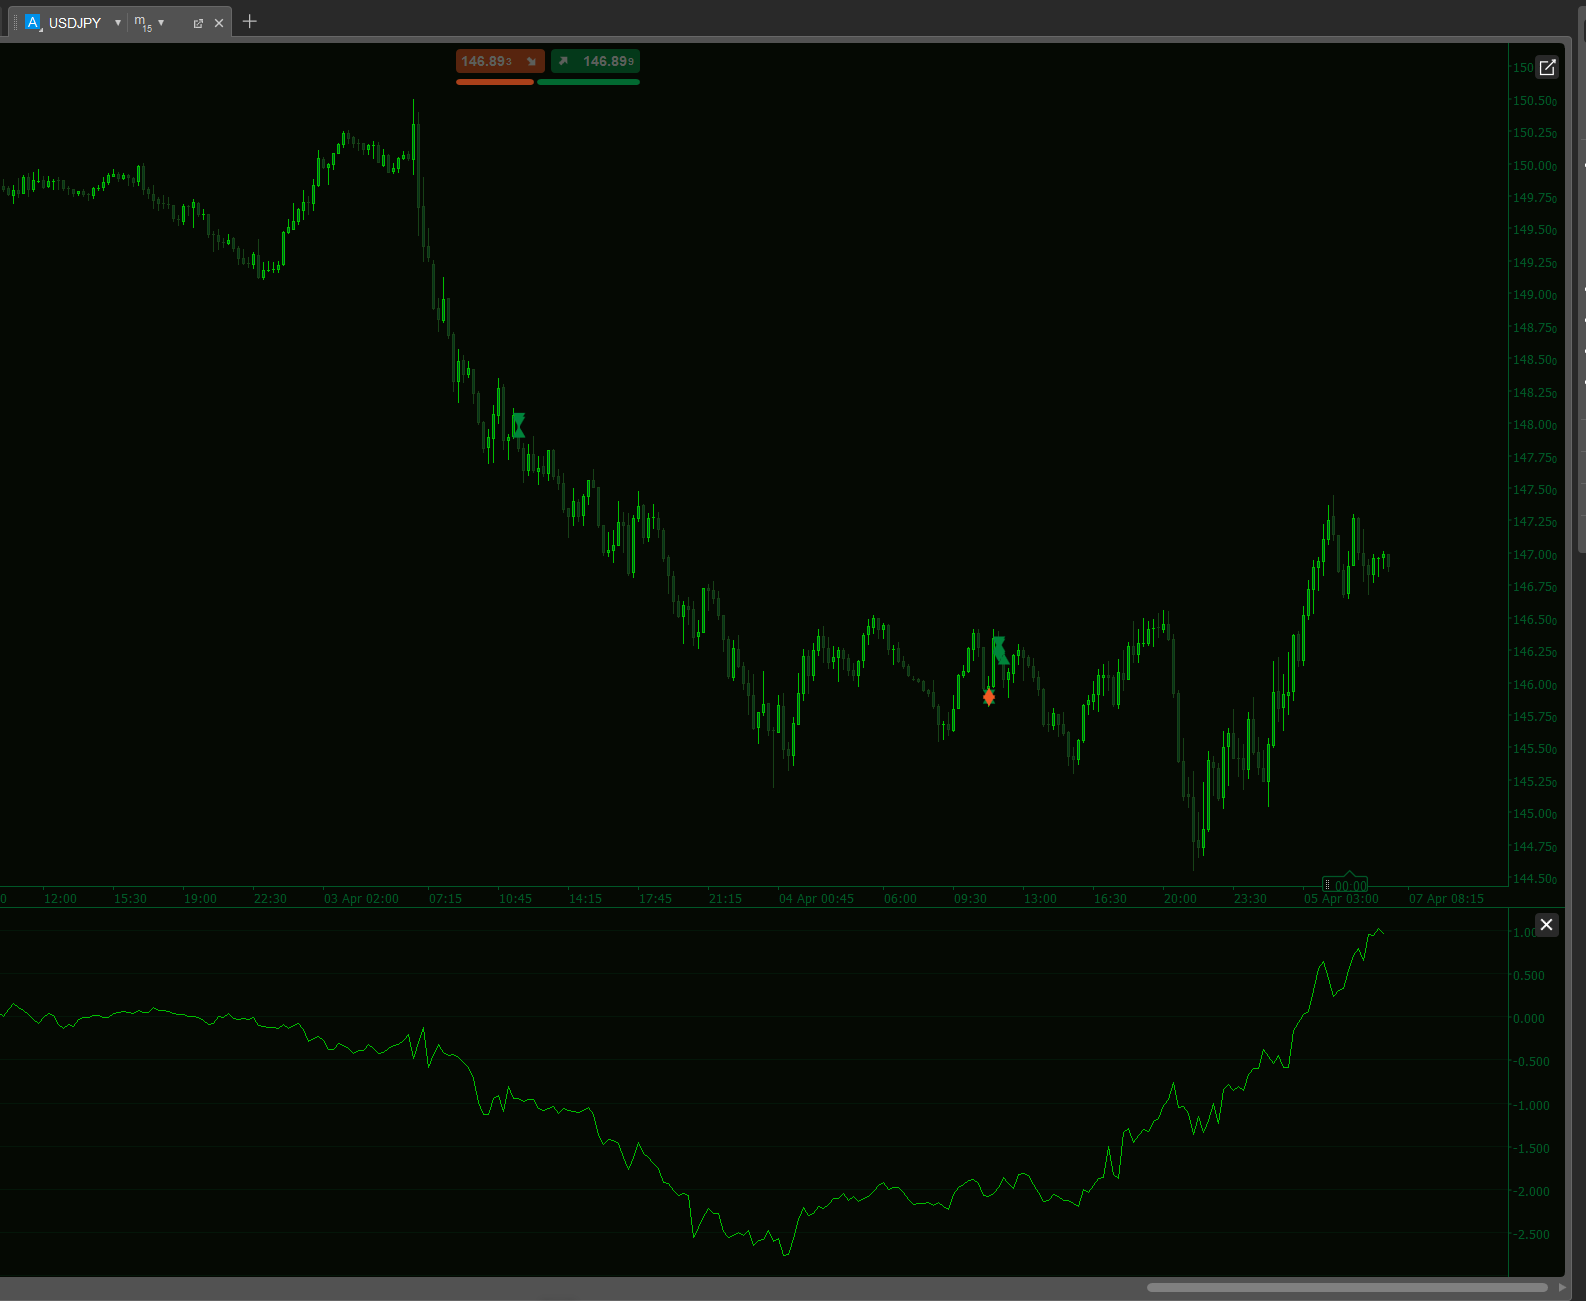
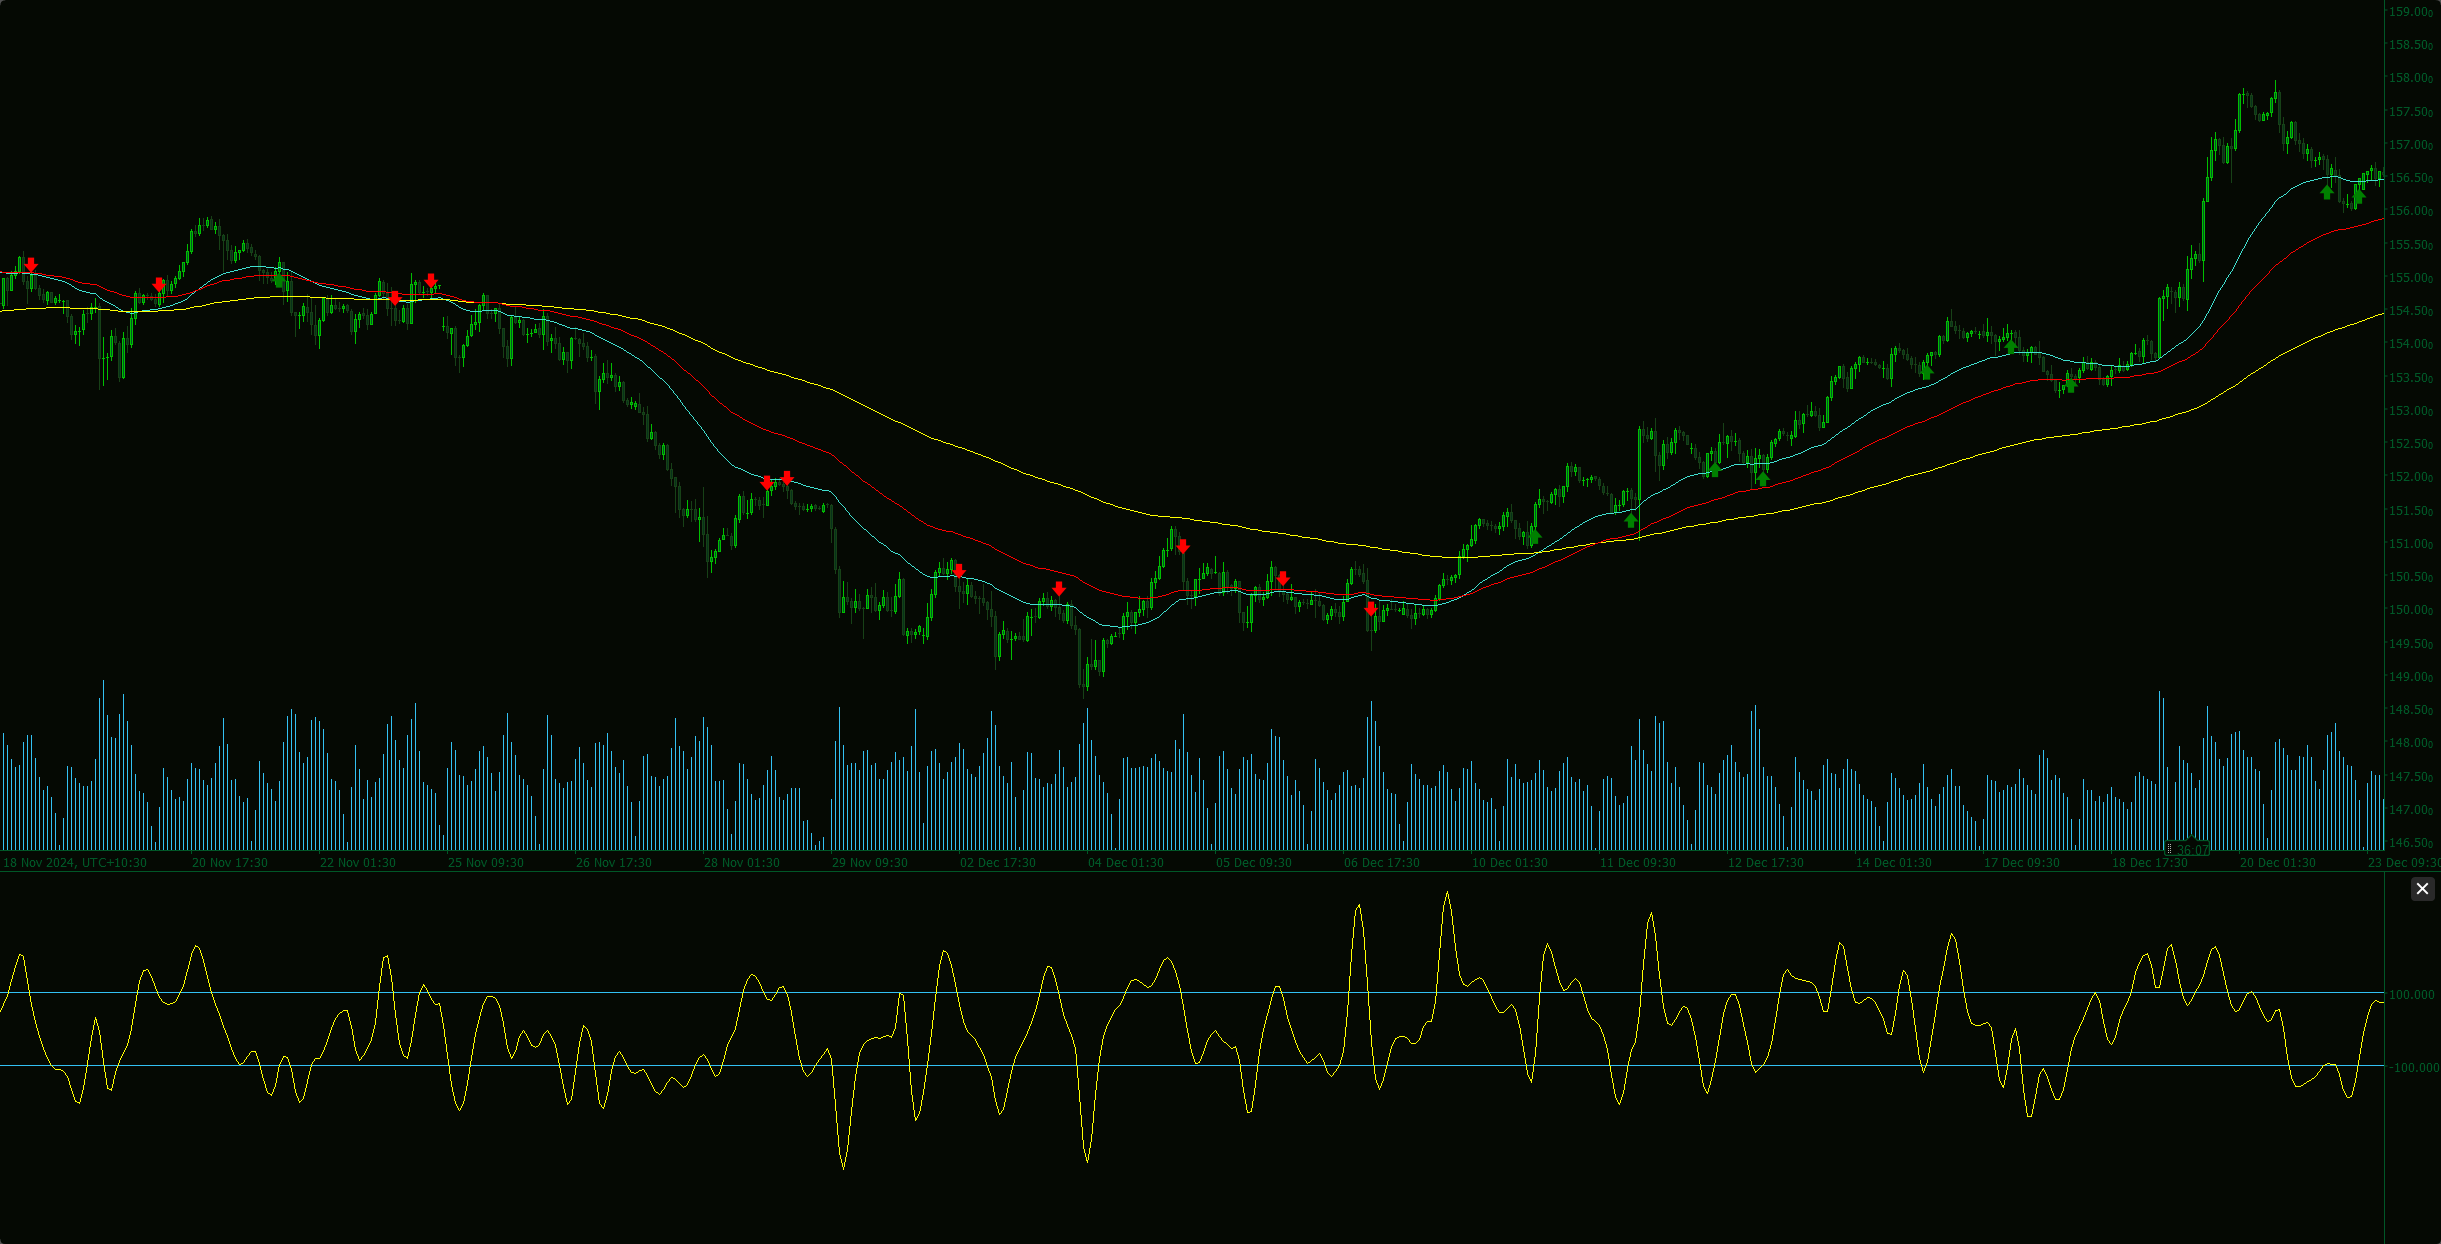
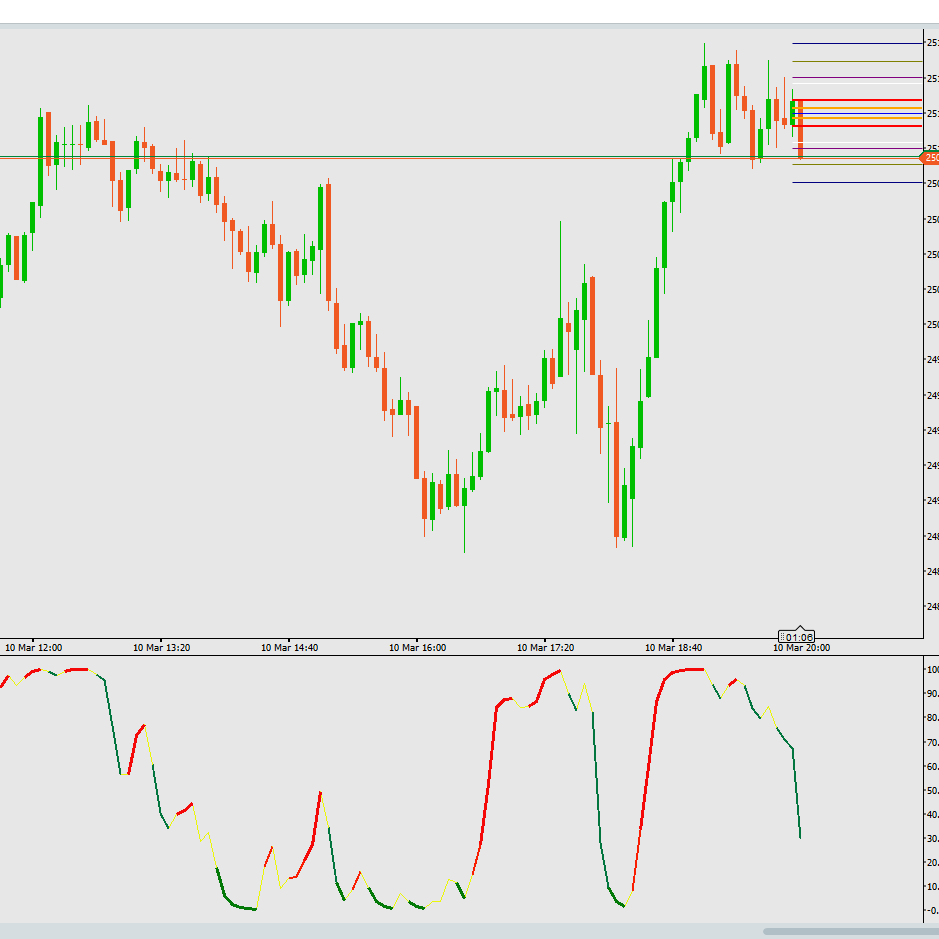
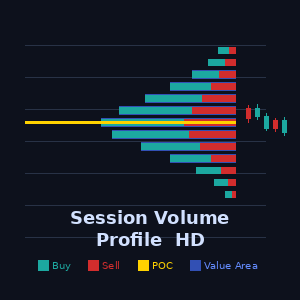
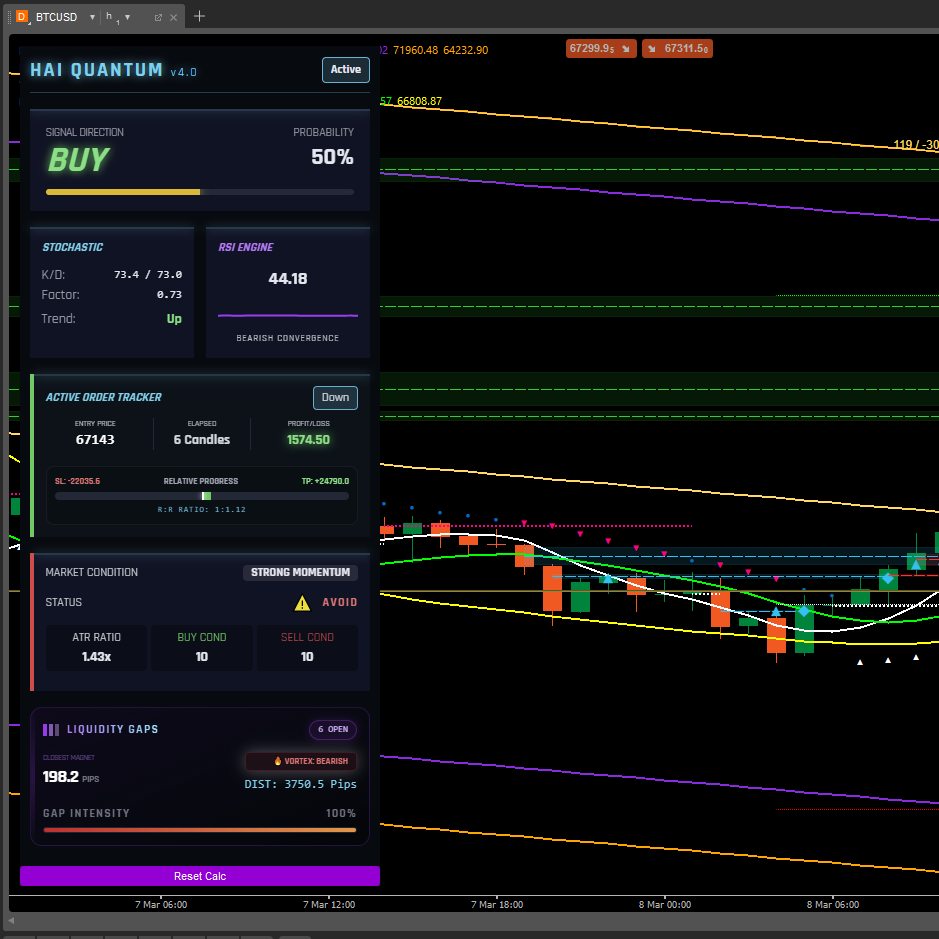
The Advanced Volume Profile Indicator is a professional trading tool designed to provide deep market insights through volume analysis. It calculates the Point of Control (POC), Median, and Mode, offering a precise view of price levels where significant market activity occurs.
Key Features:
0.0
Reviews: 0
Customer reviews
No reviews for this product yet. Already tried it? Be the first to tell others!
More from this author
Indicator
Forex
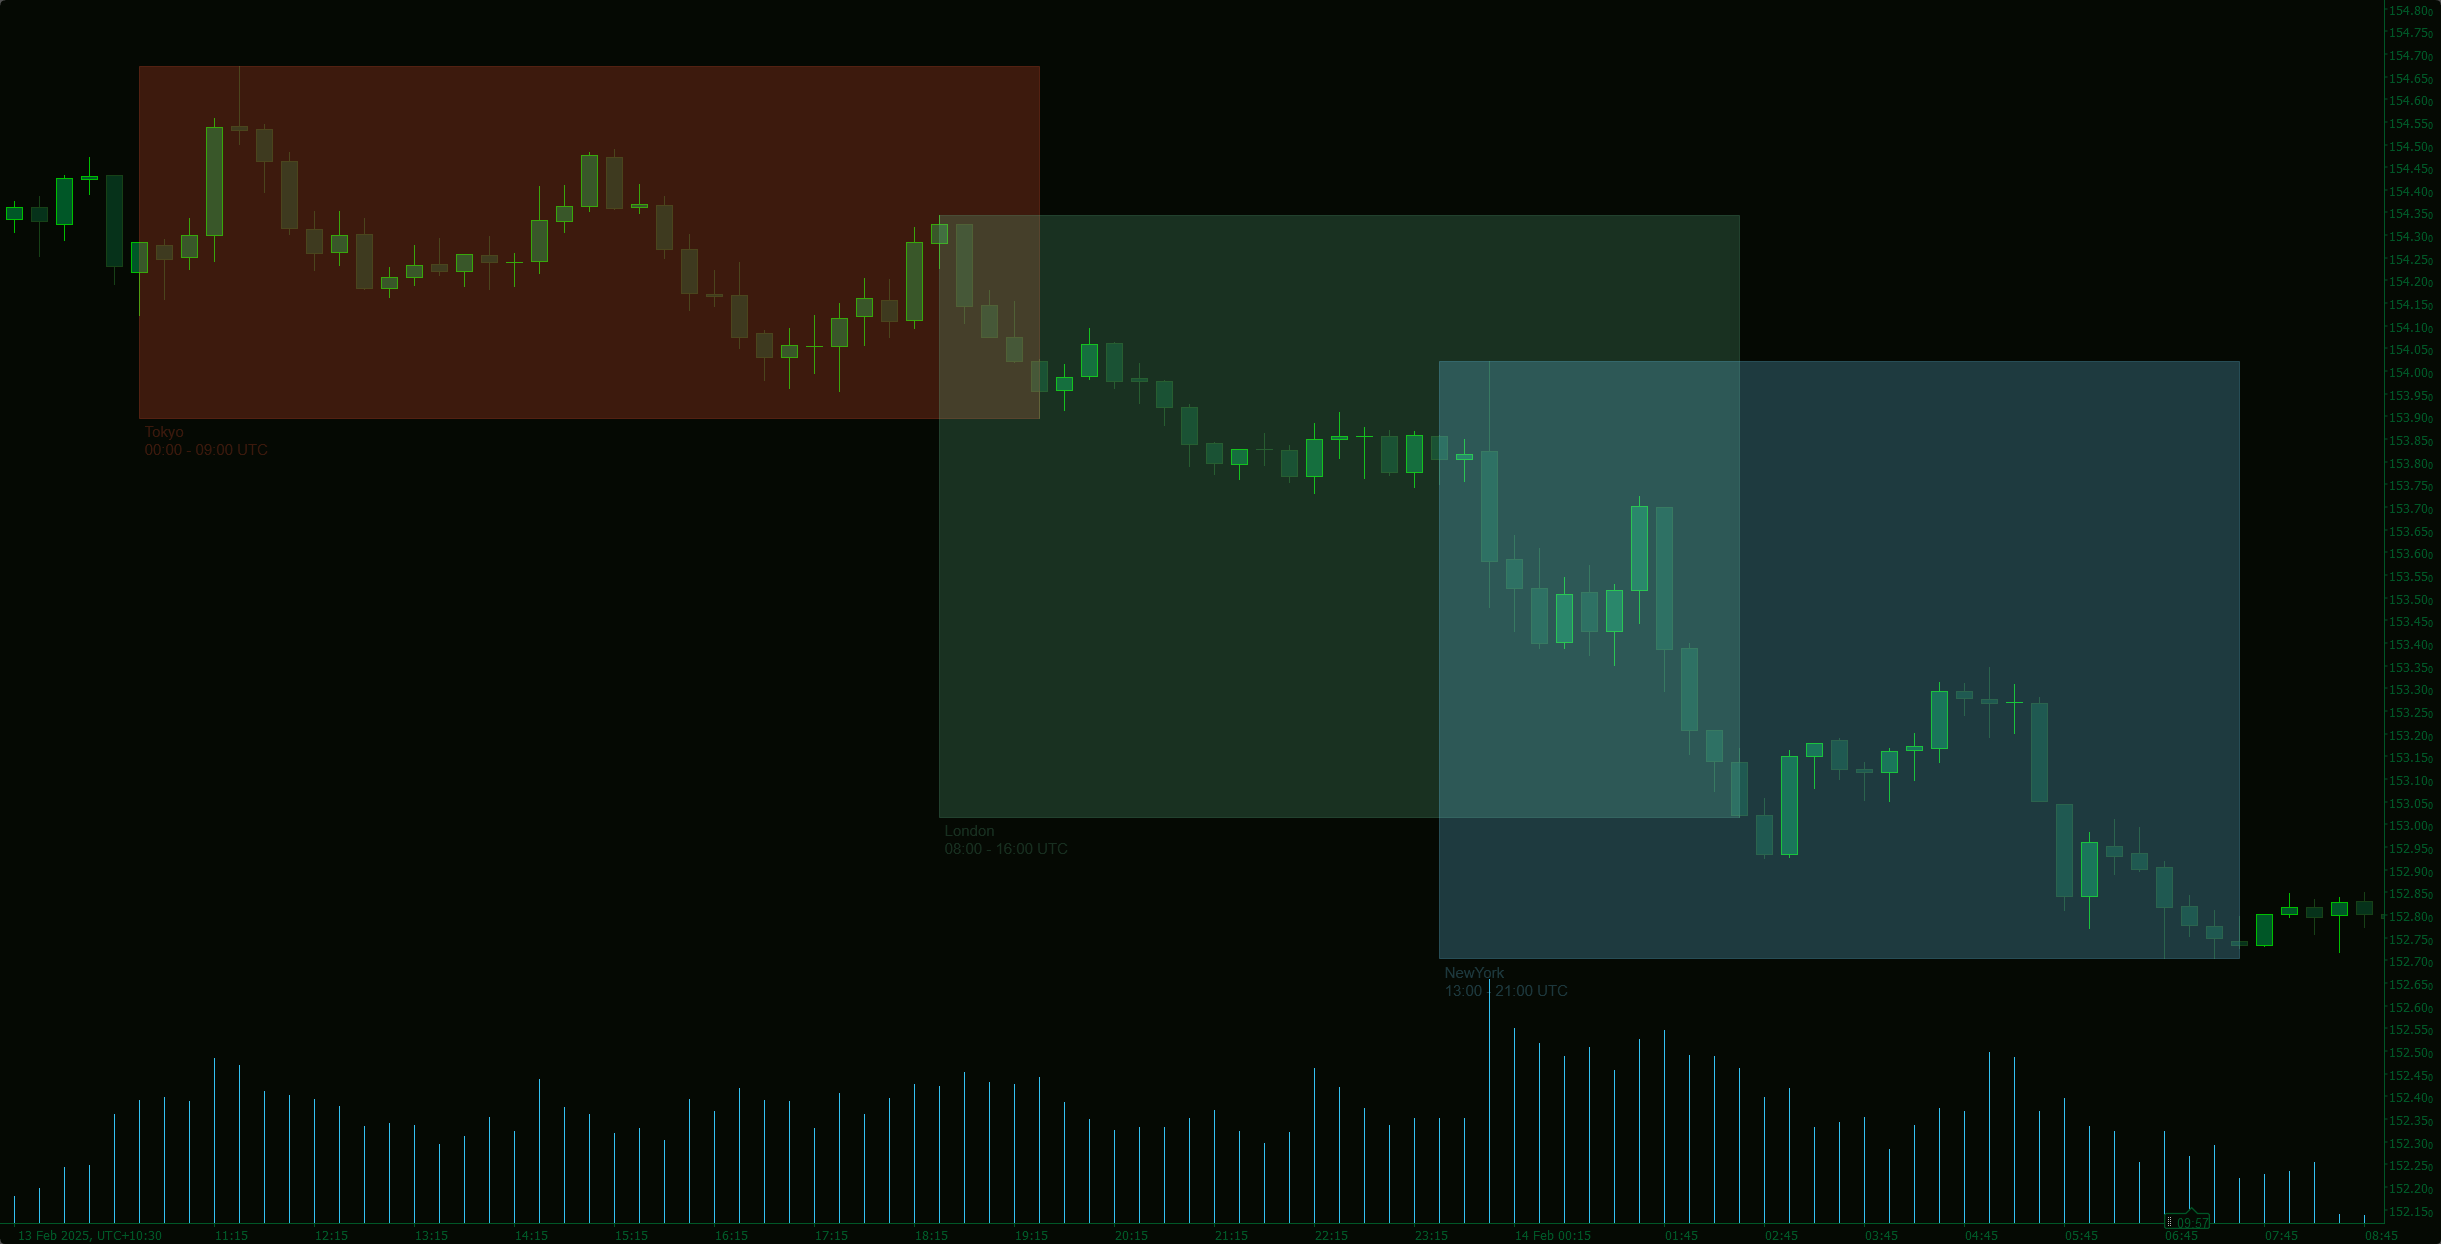
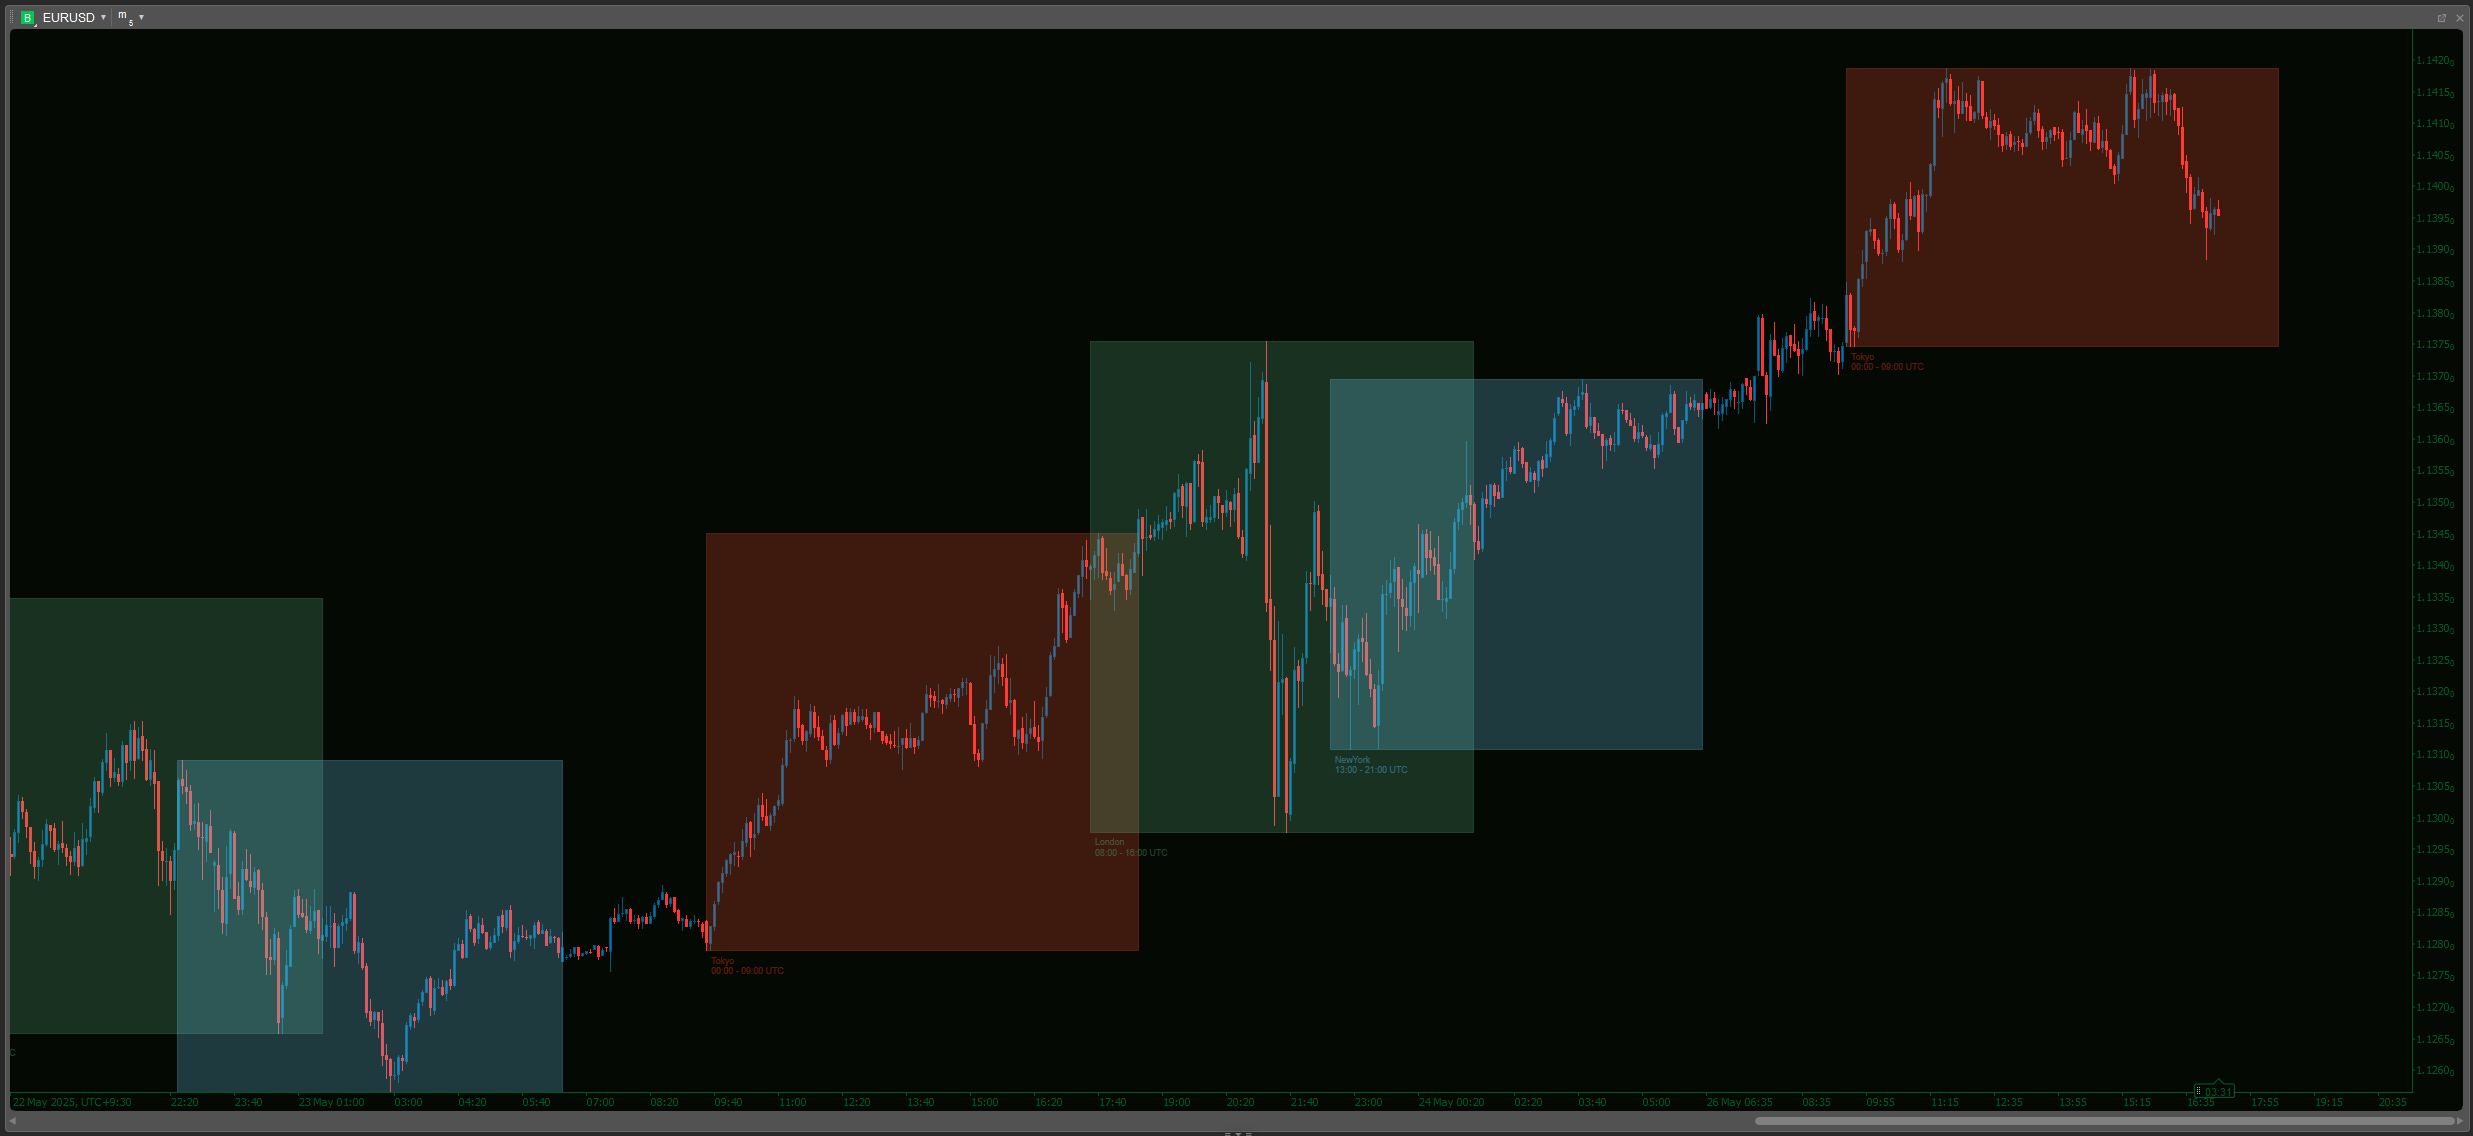
Market Session V2: Full Control. colors, history, session/text toggles, font size. Elevate your strategy!

Indicator
Forex
Version 3: Full control of session display including start and end times of all 3 sessions!
Indicator
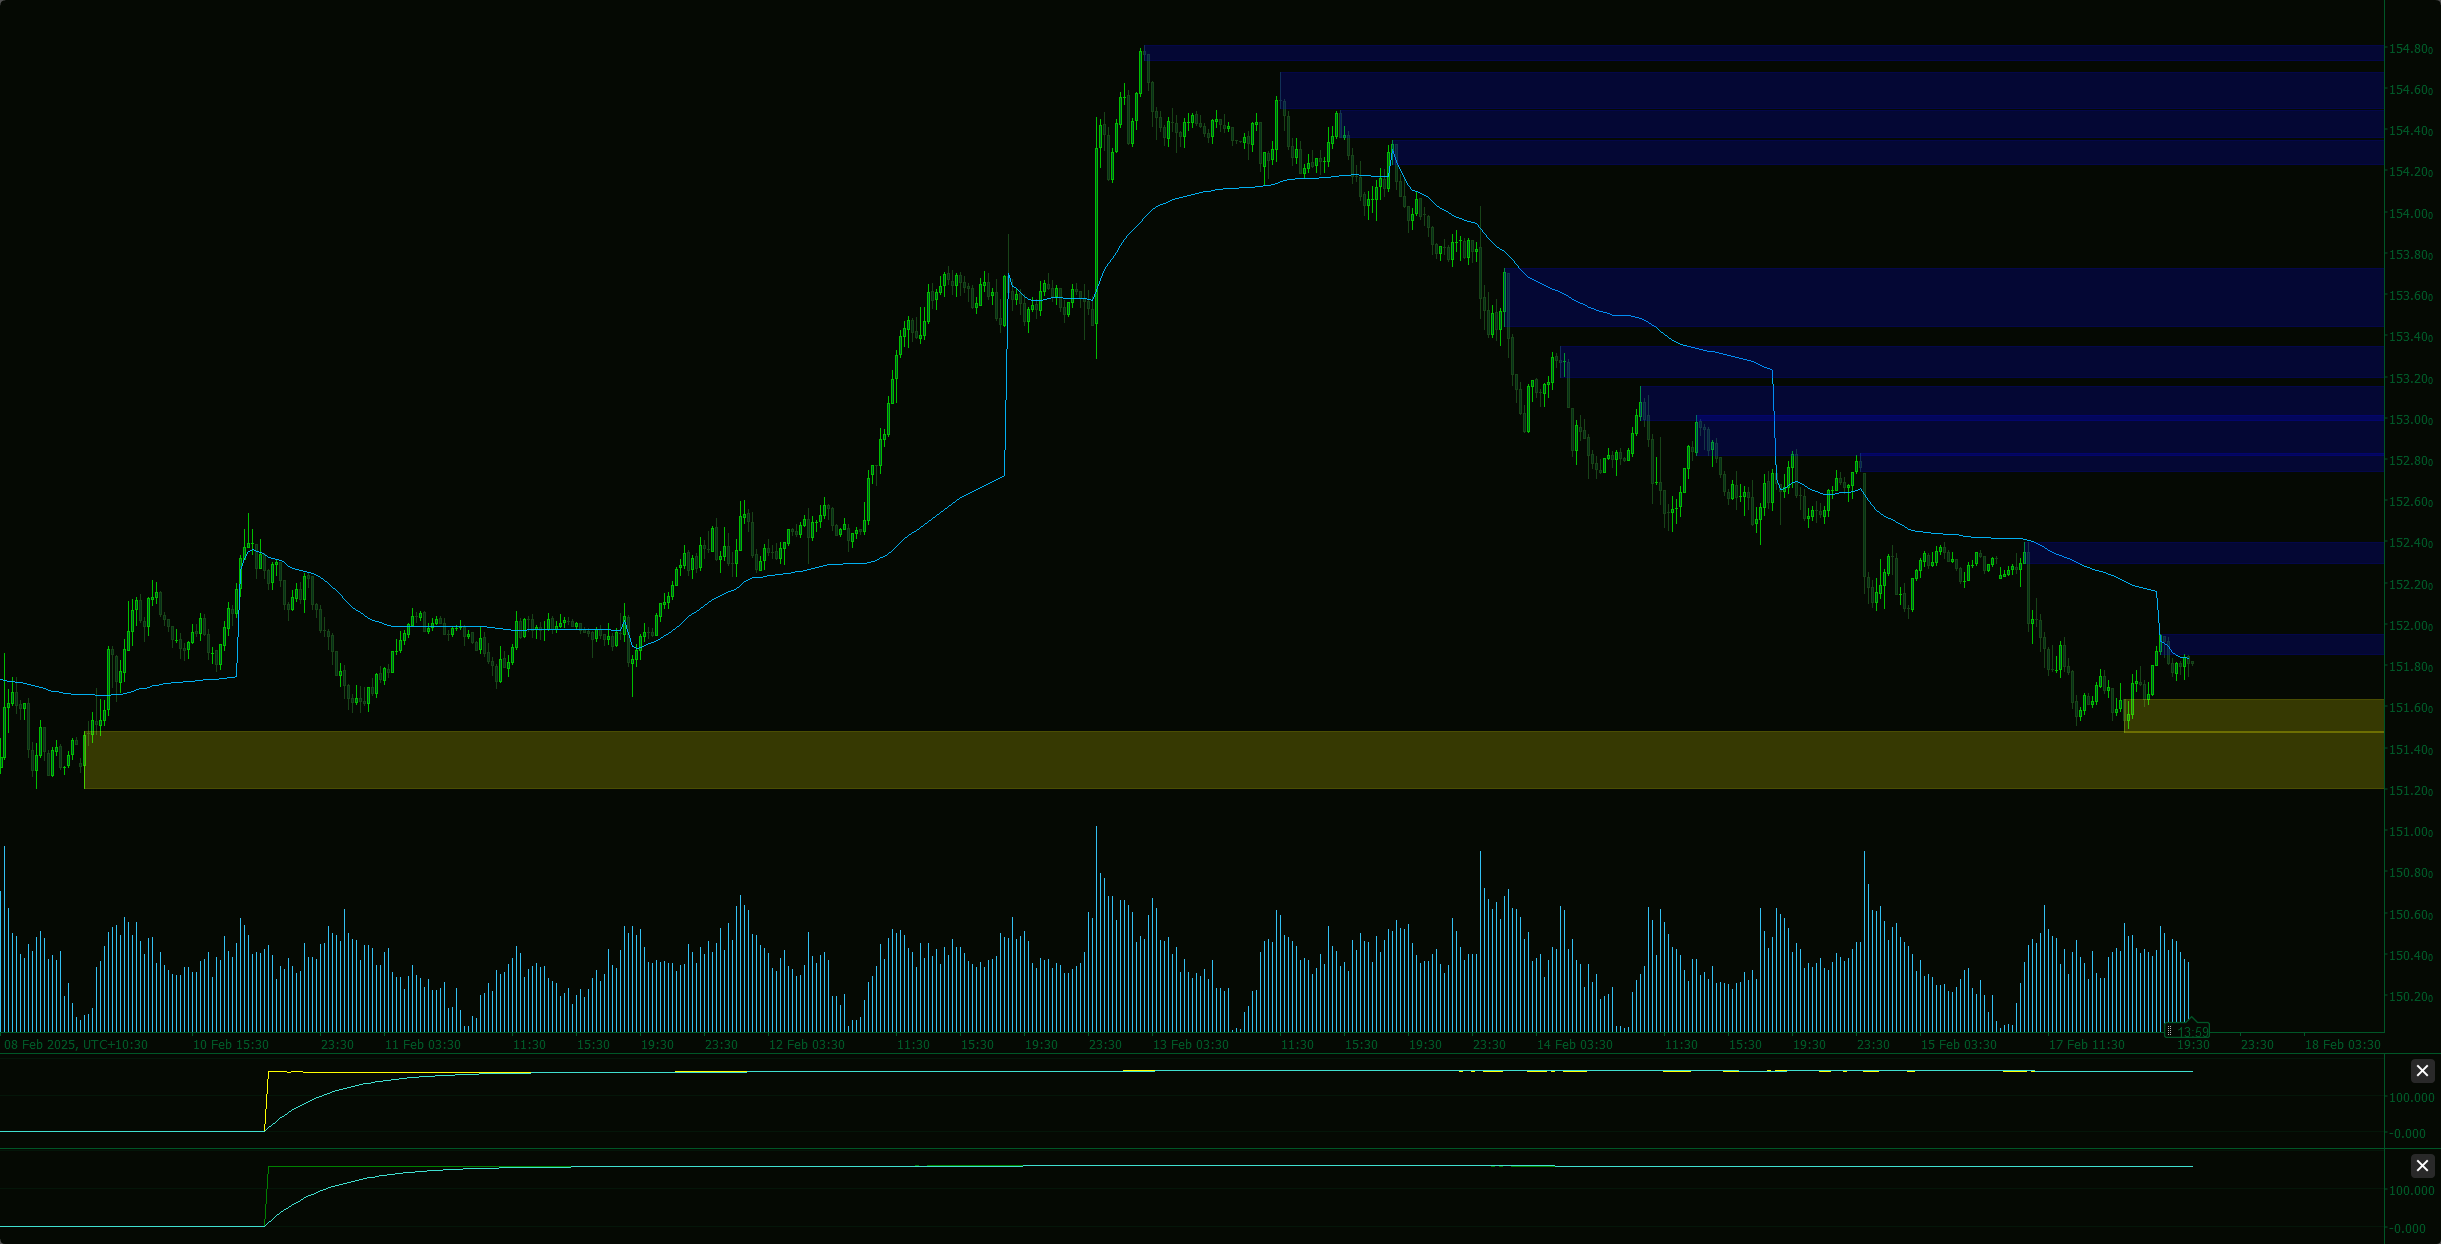
VWAP
VWAP Set to London Open
Indicator
VWAP
VWAP Set to Tokyo Open
You may also like


Since 14/01/2025
41
Sales
8.82K
Free installs