Brokers & props
For business
00
Days
:
00
Hours
:
00
Minutes
:
00
Seconds
Indicator
Indices
Commodities
CCI - With Arrows and 40 80 EMA Logic_noSourceCode
18/07/2025
1
Desktop
Since 14/01/2025
Sales
35
Free installs
6943
"CCI - With Arrows and 40 80 EMA Logic_noSourceCode" uploaded image"CCI - With Arrows and 40 80 EMA Logic_noSourceCode" uploaded image"CCI - With Arrows and 40 80 EMA Logic_noSourceCode" uploaded image"CCI - With Arrows and 40 80 EMA Logic_noSourceCode" uploaded image

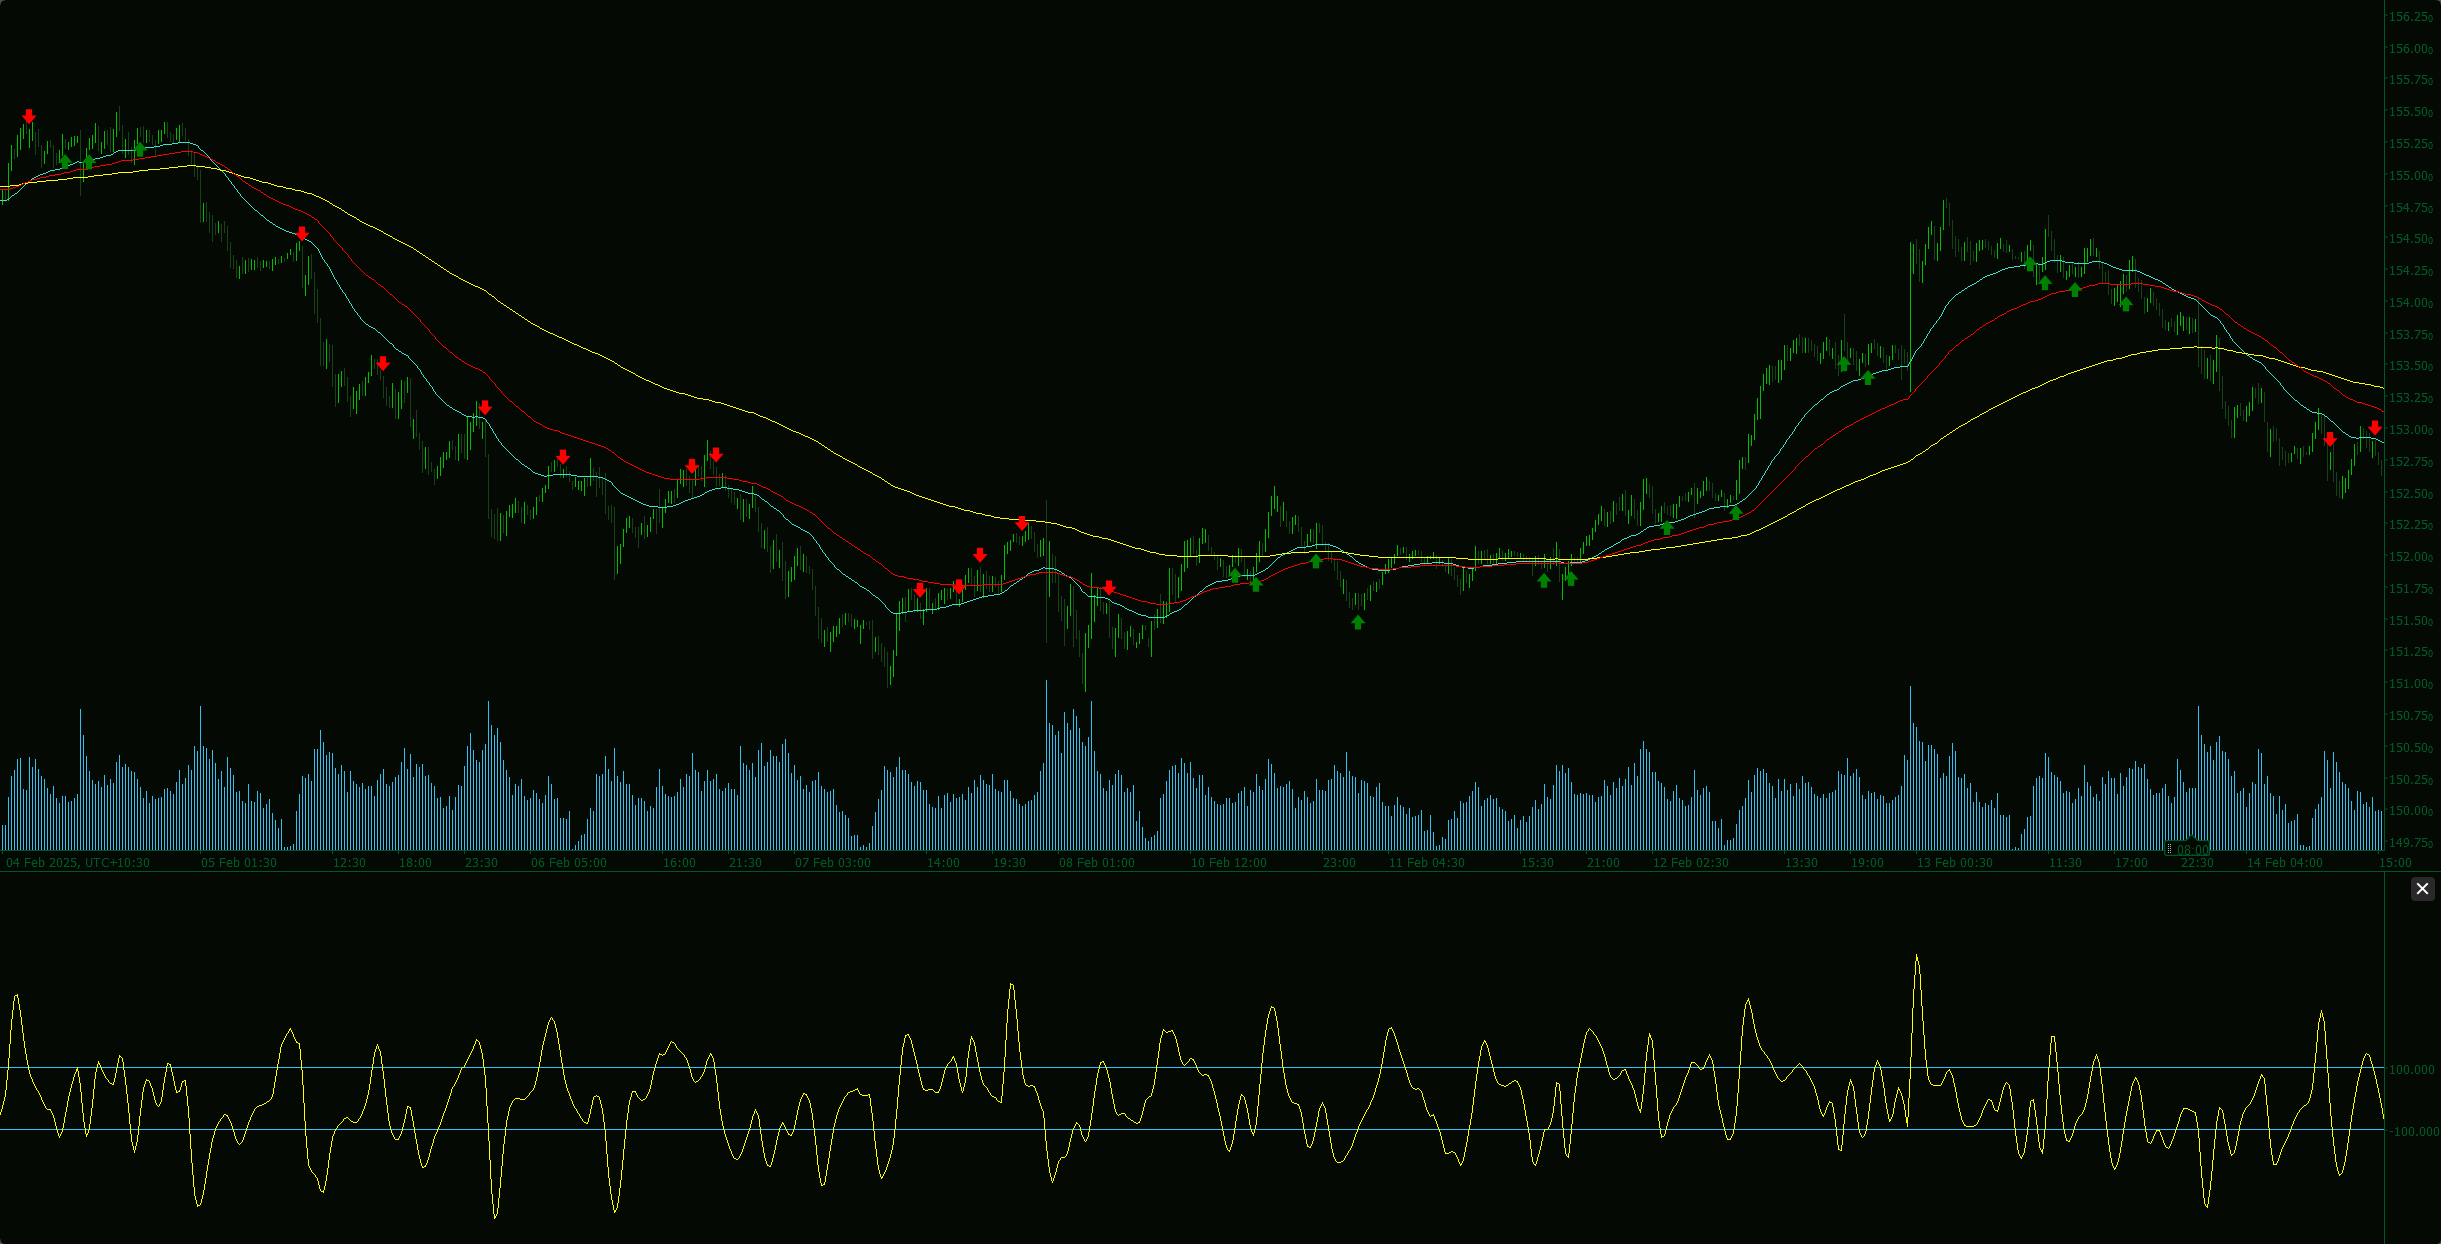
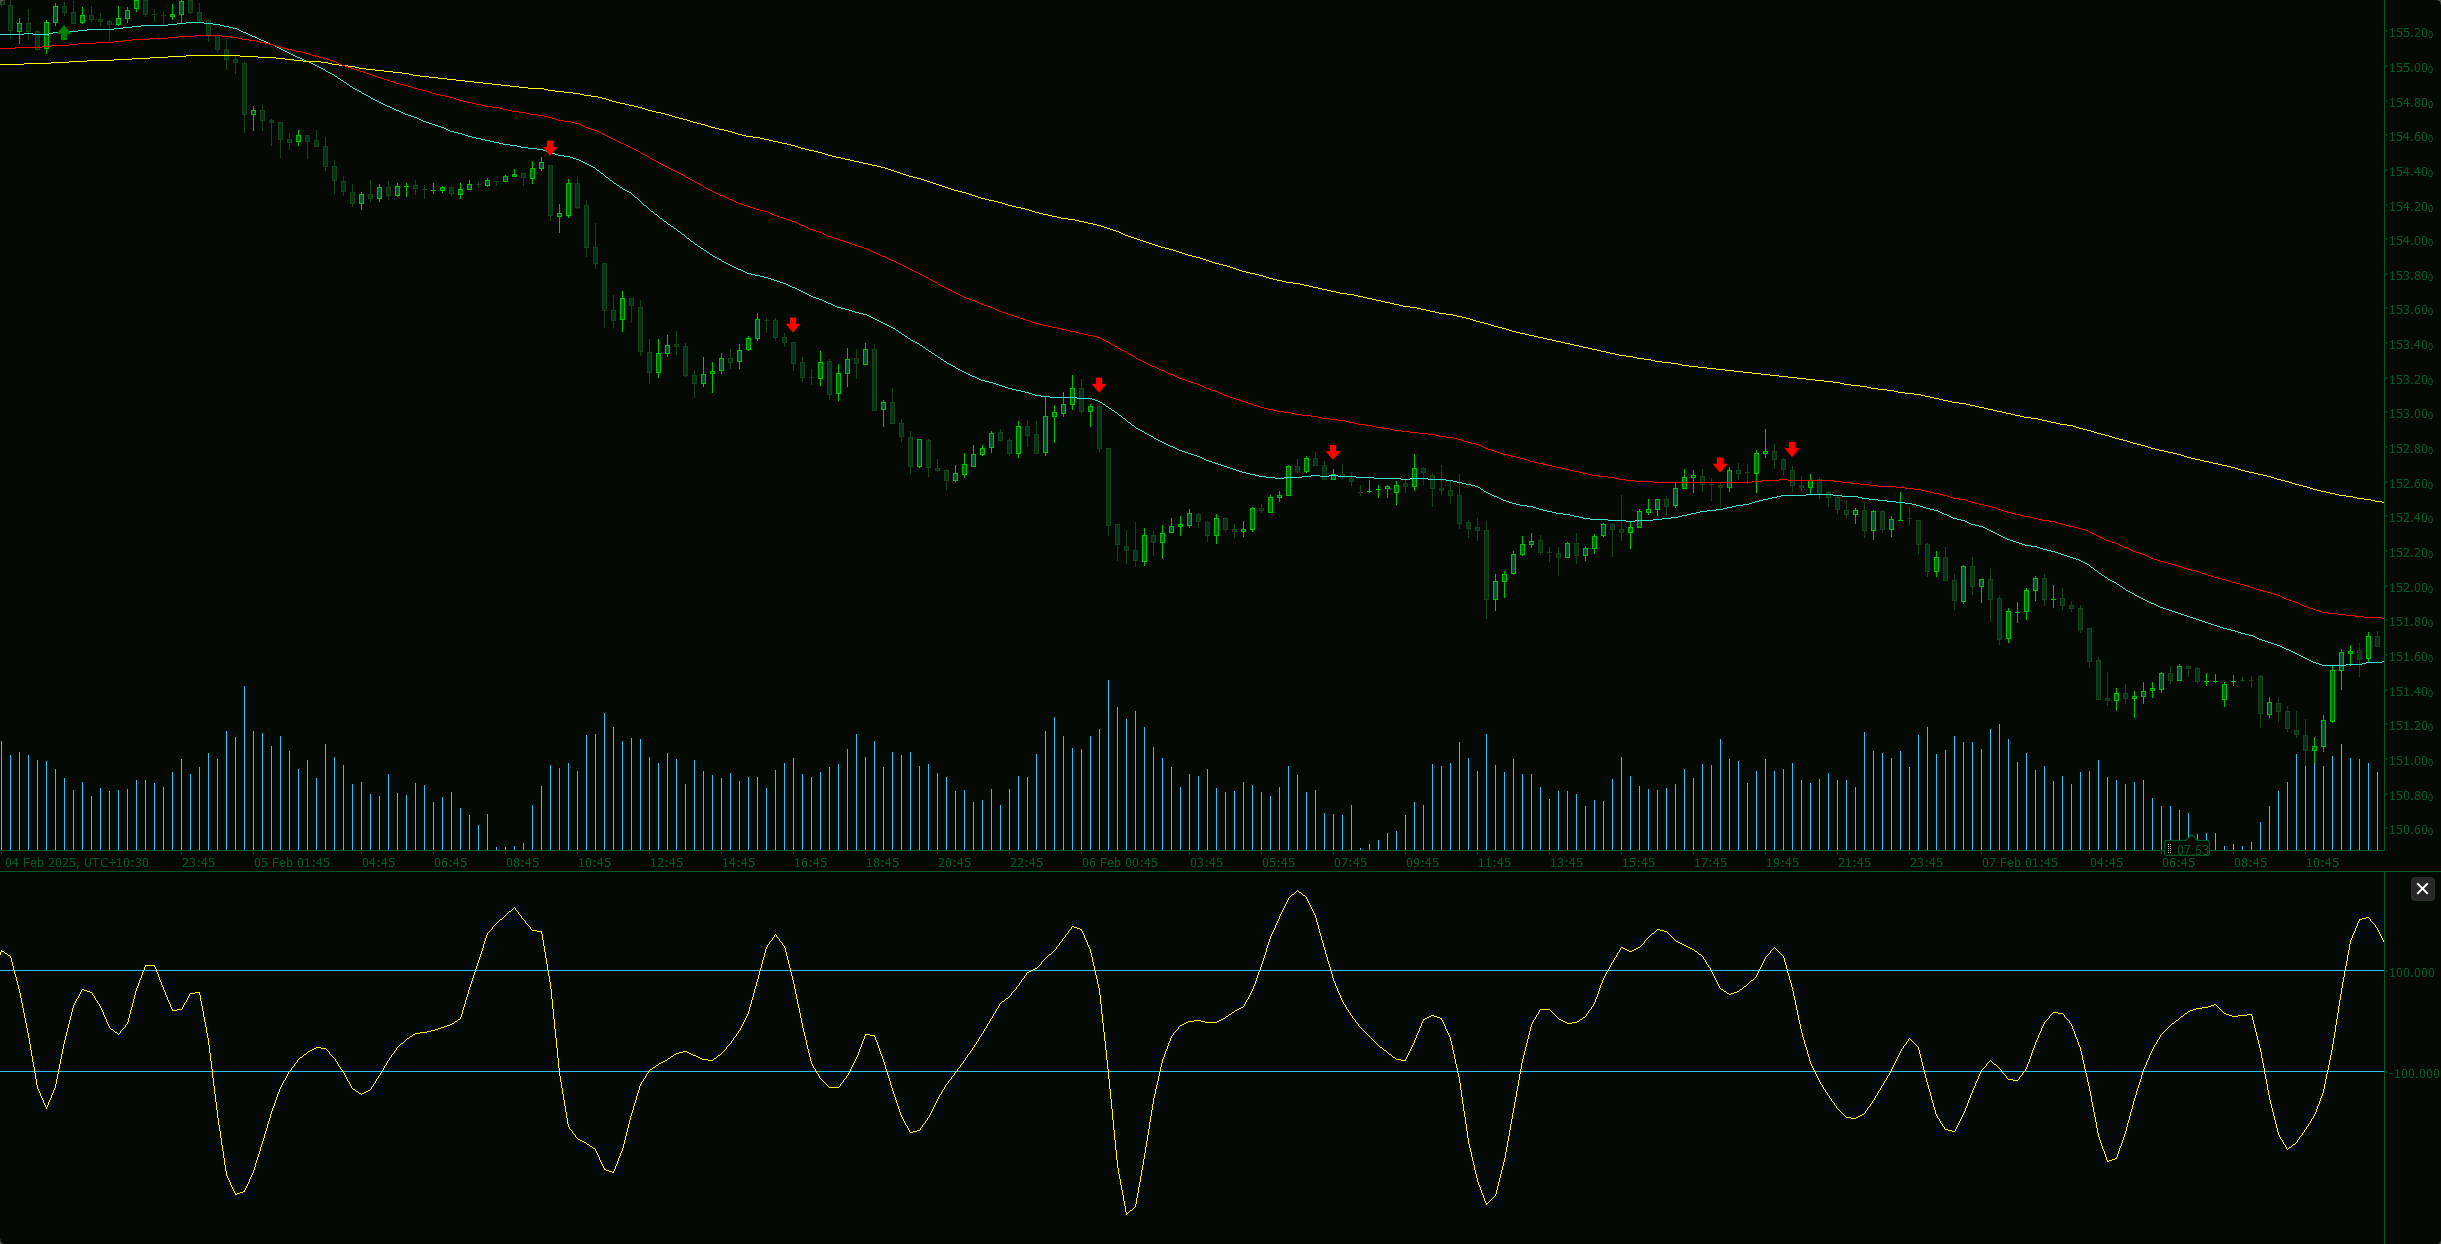
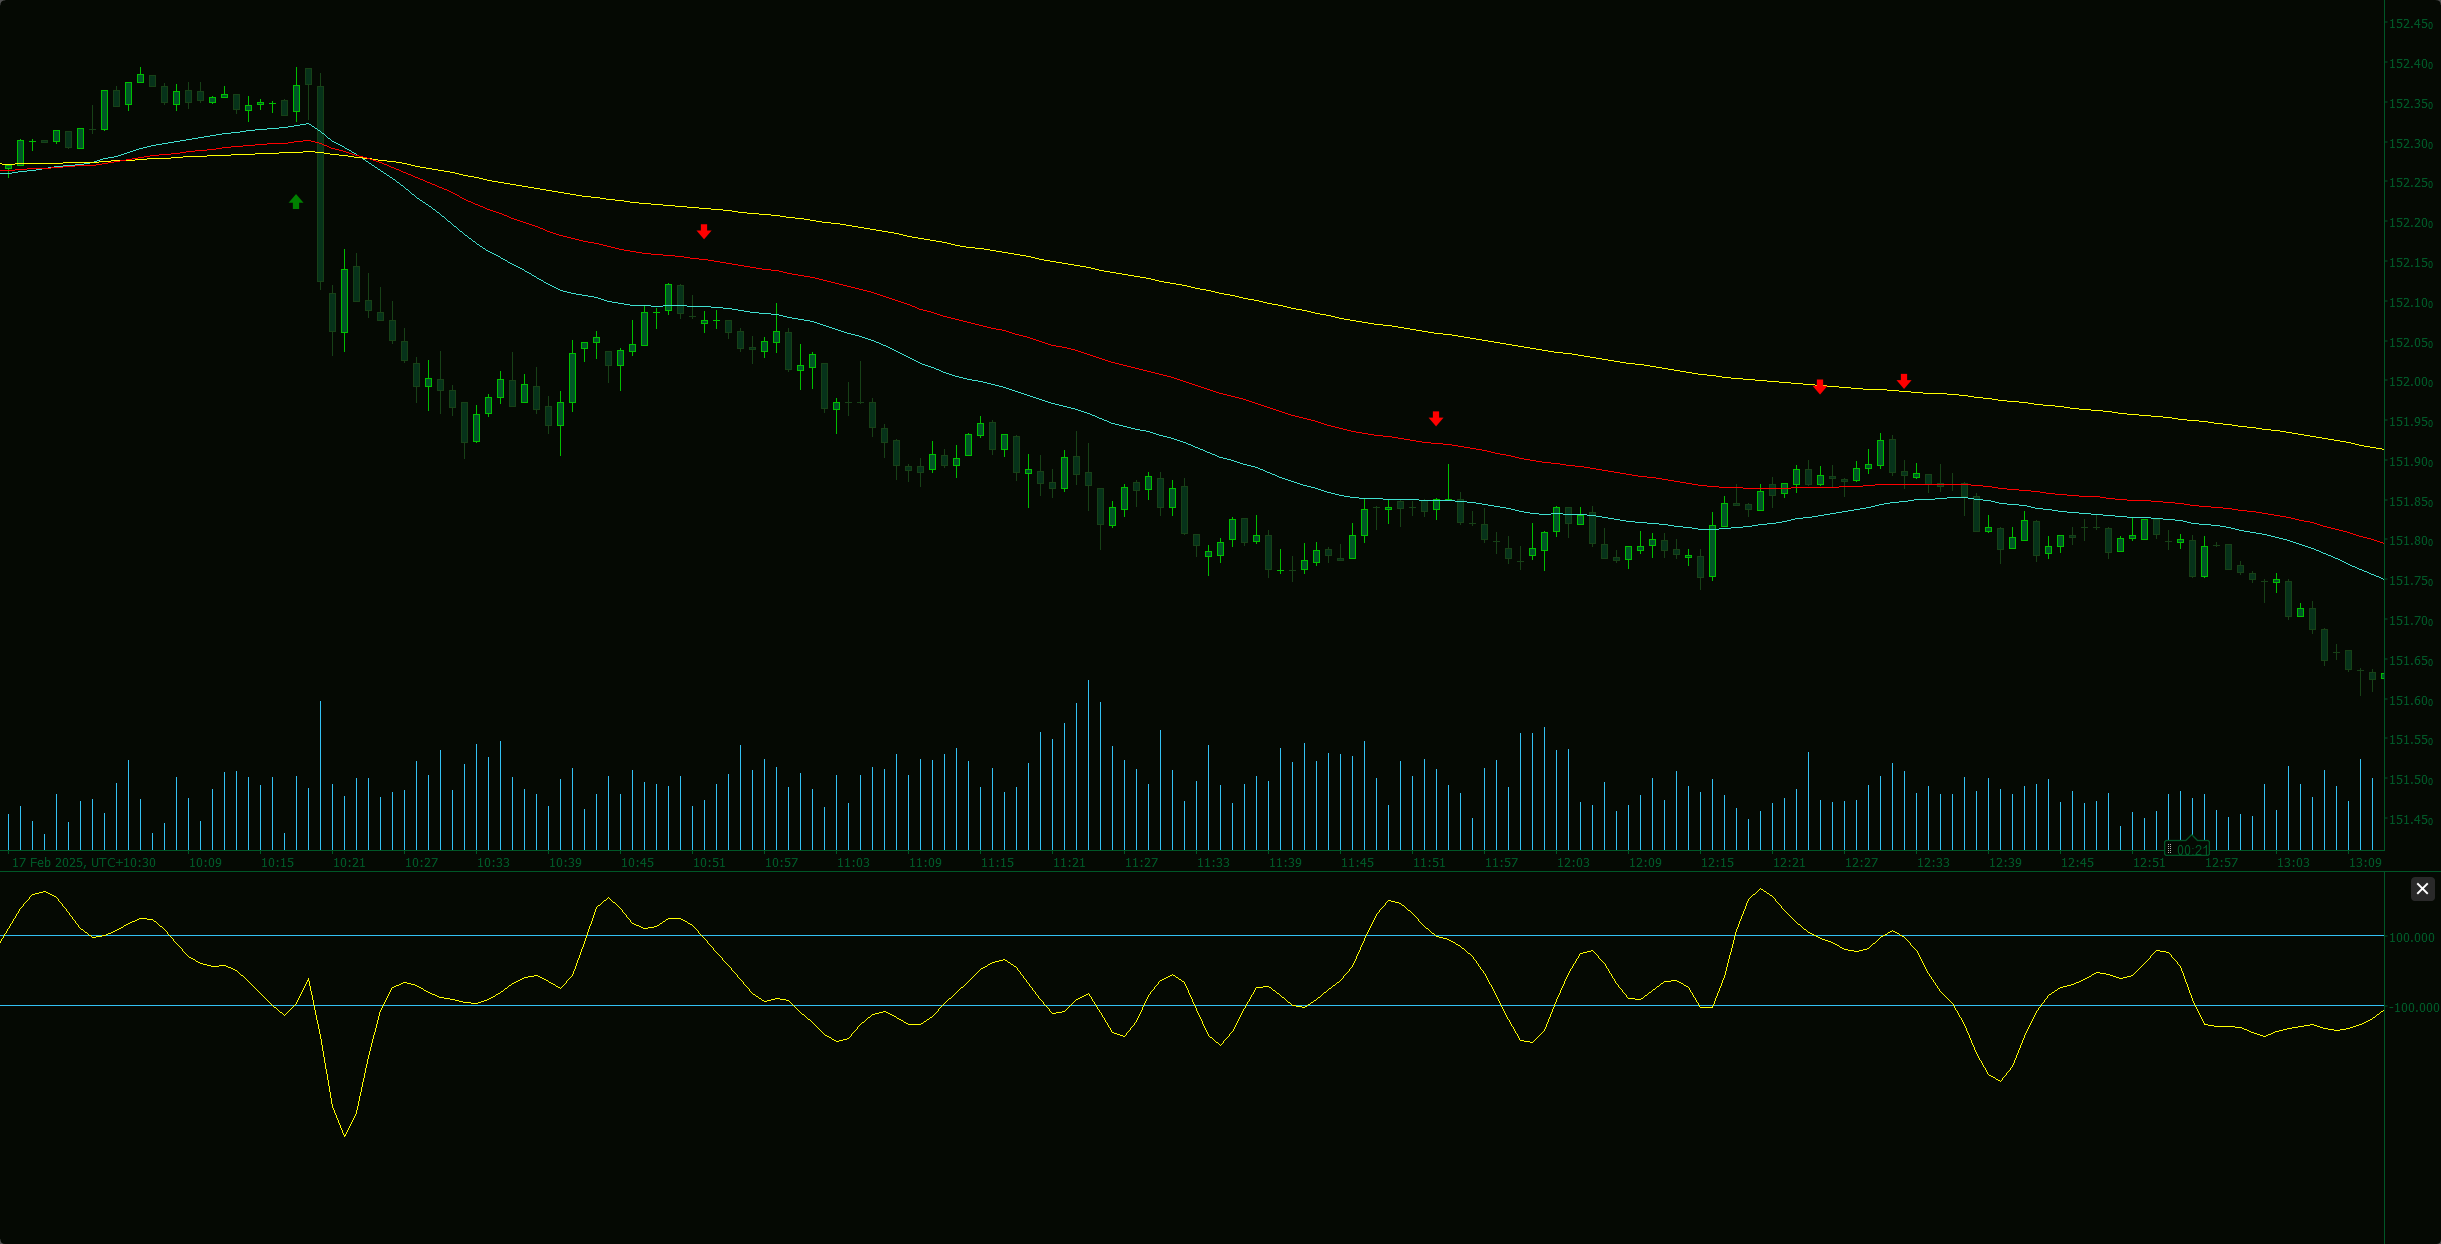
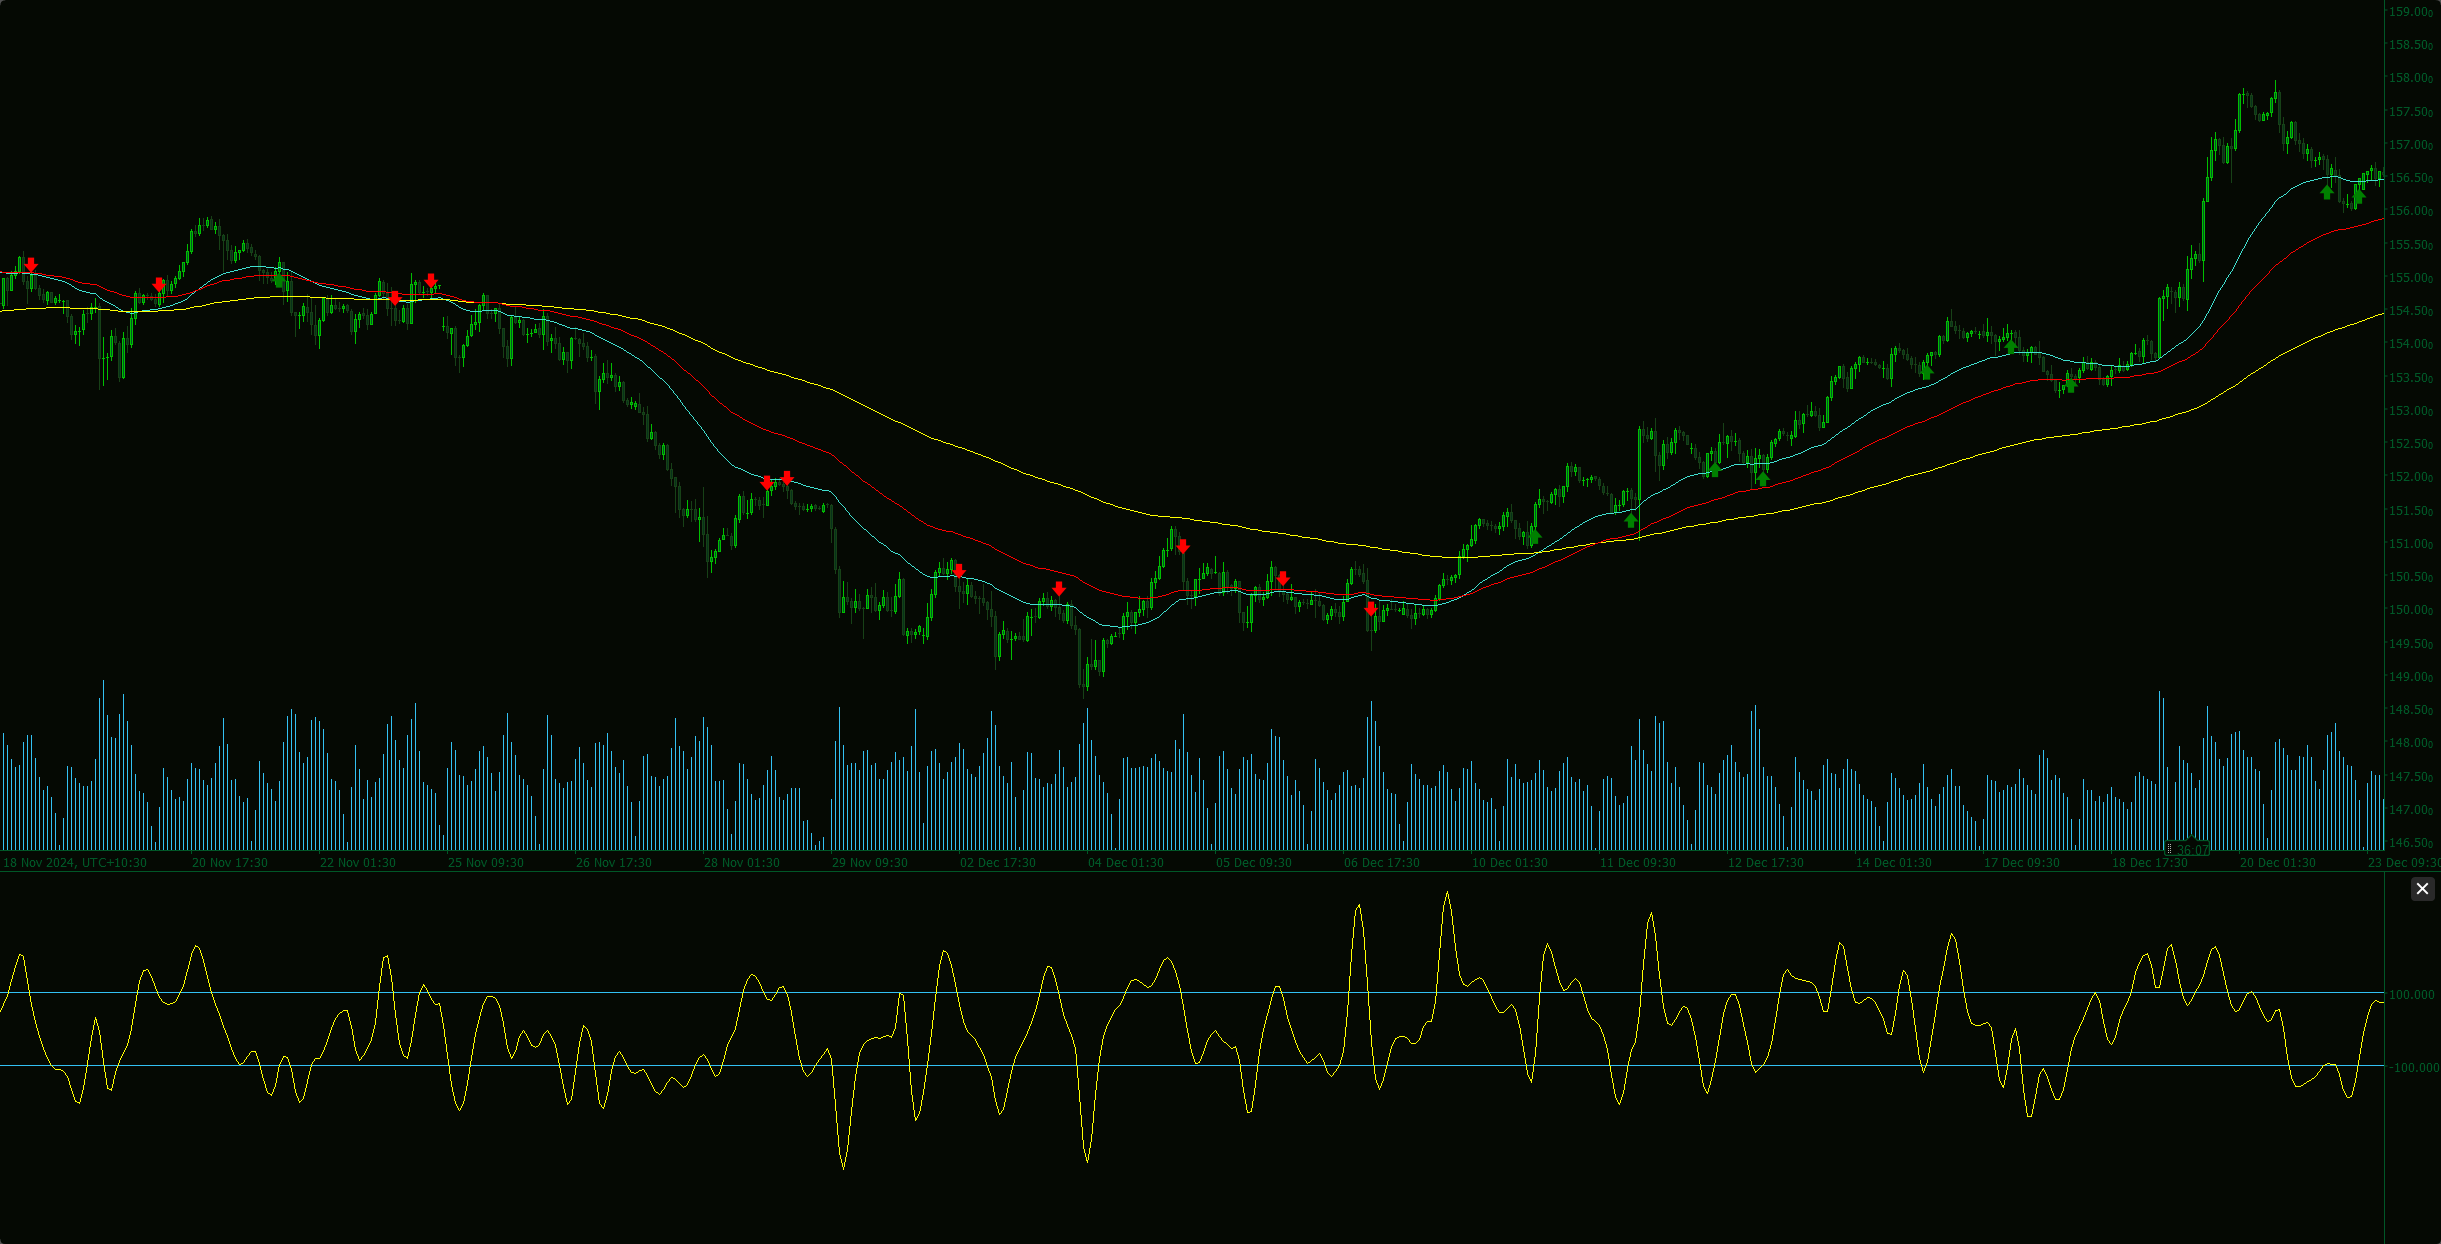
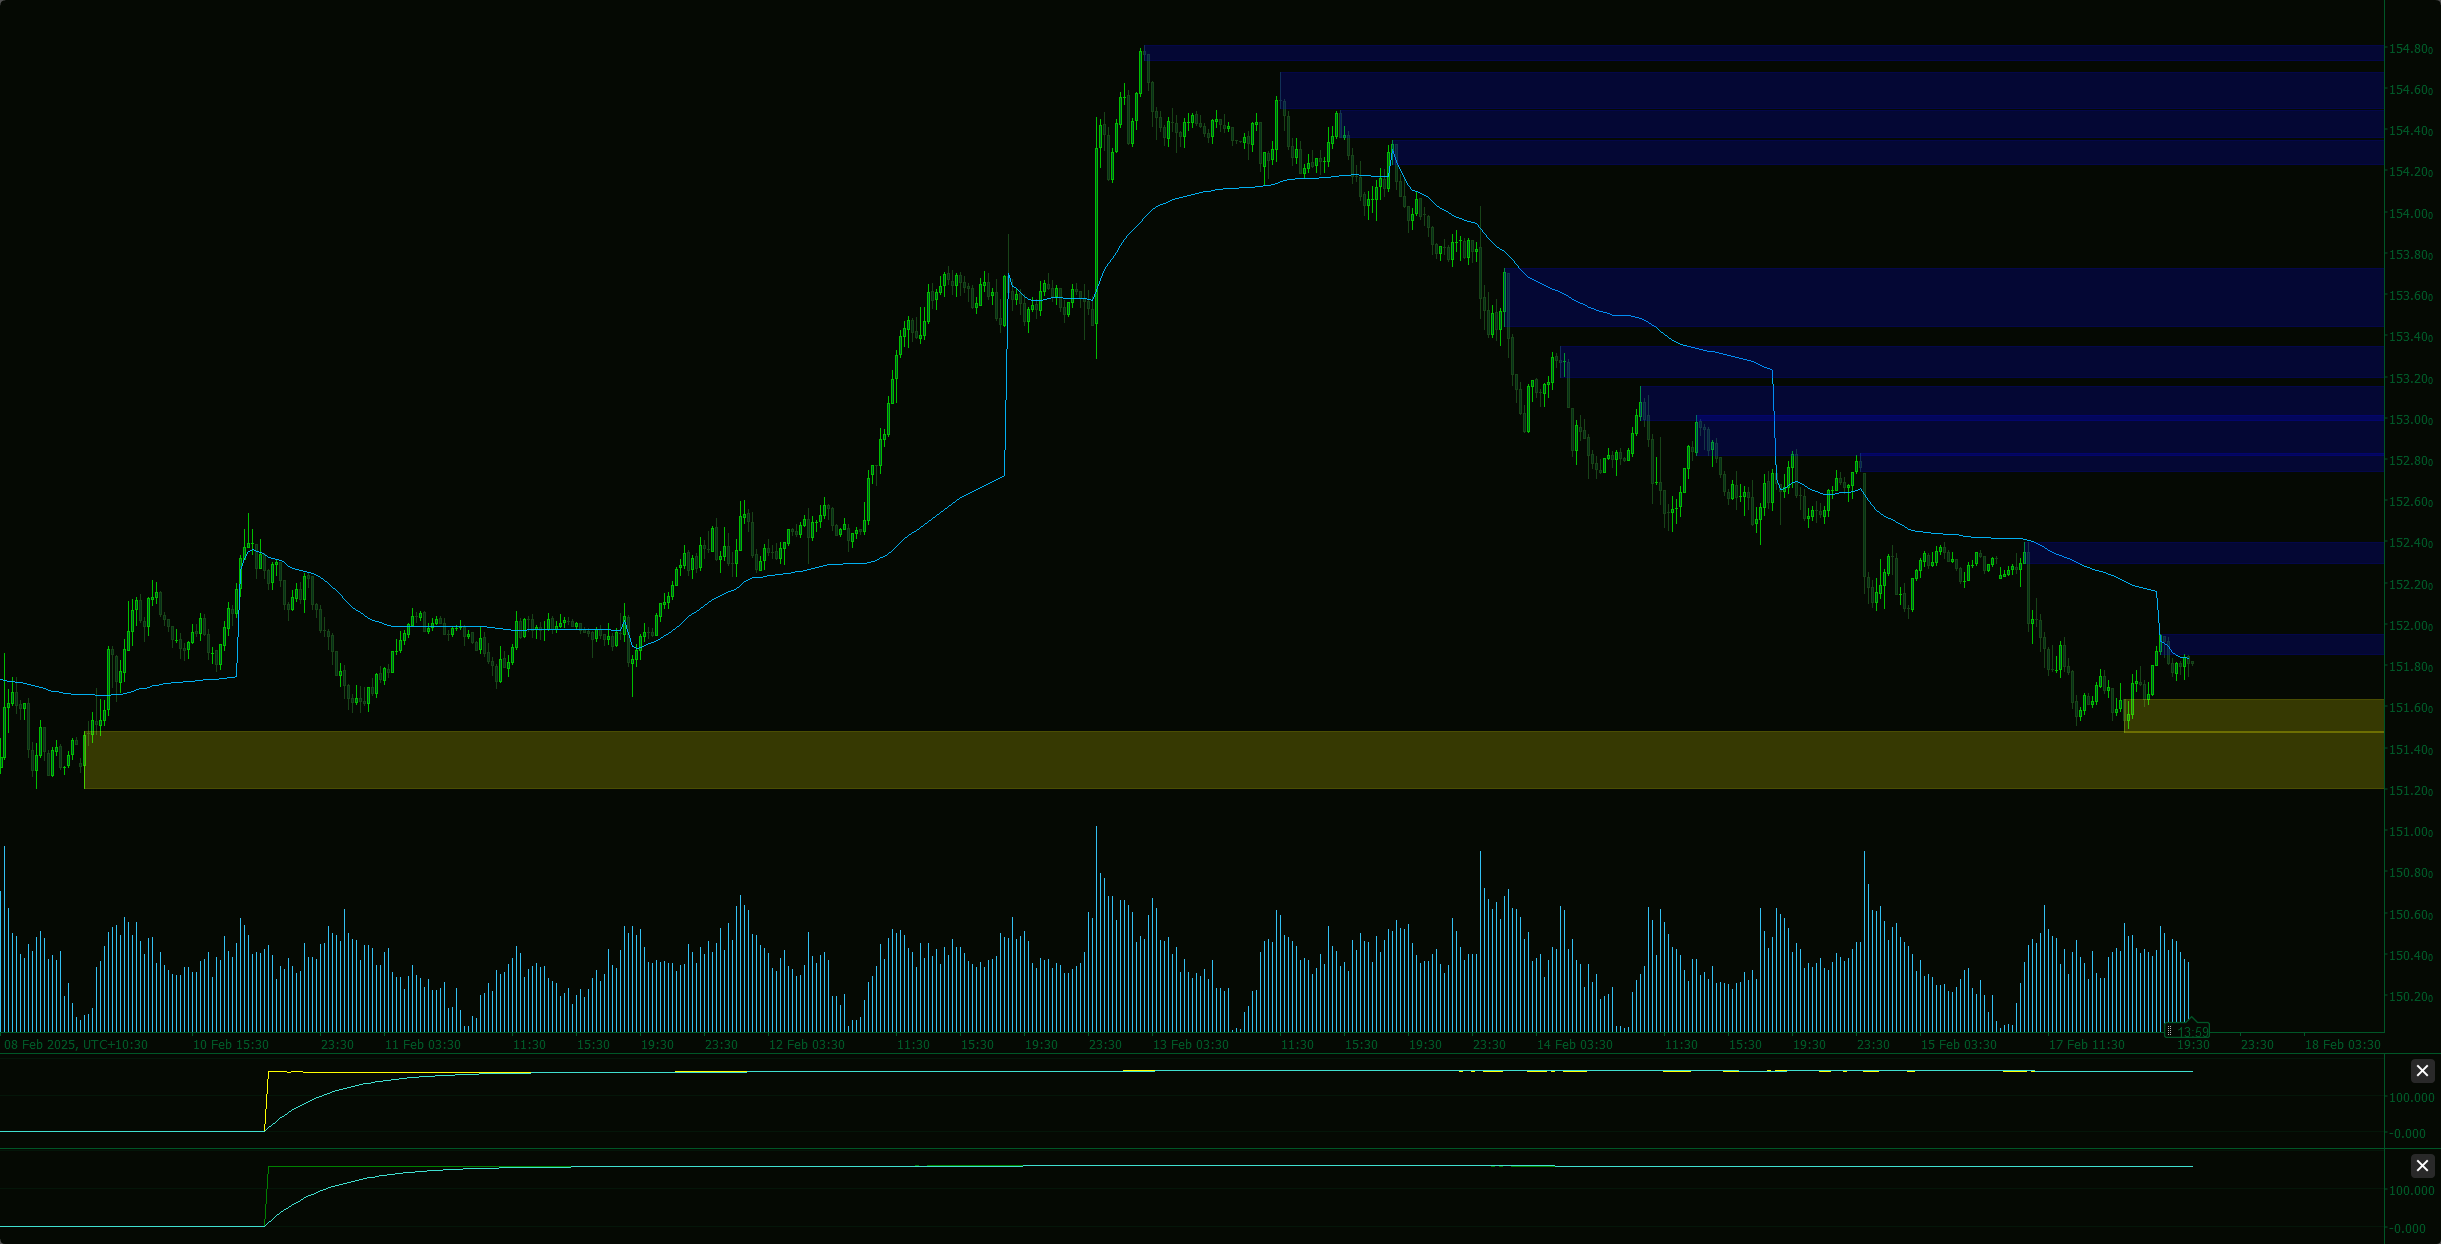
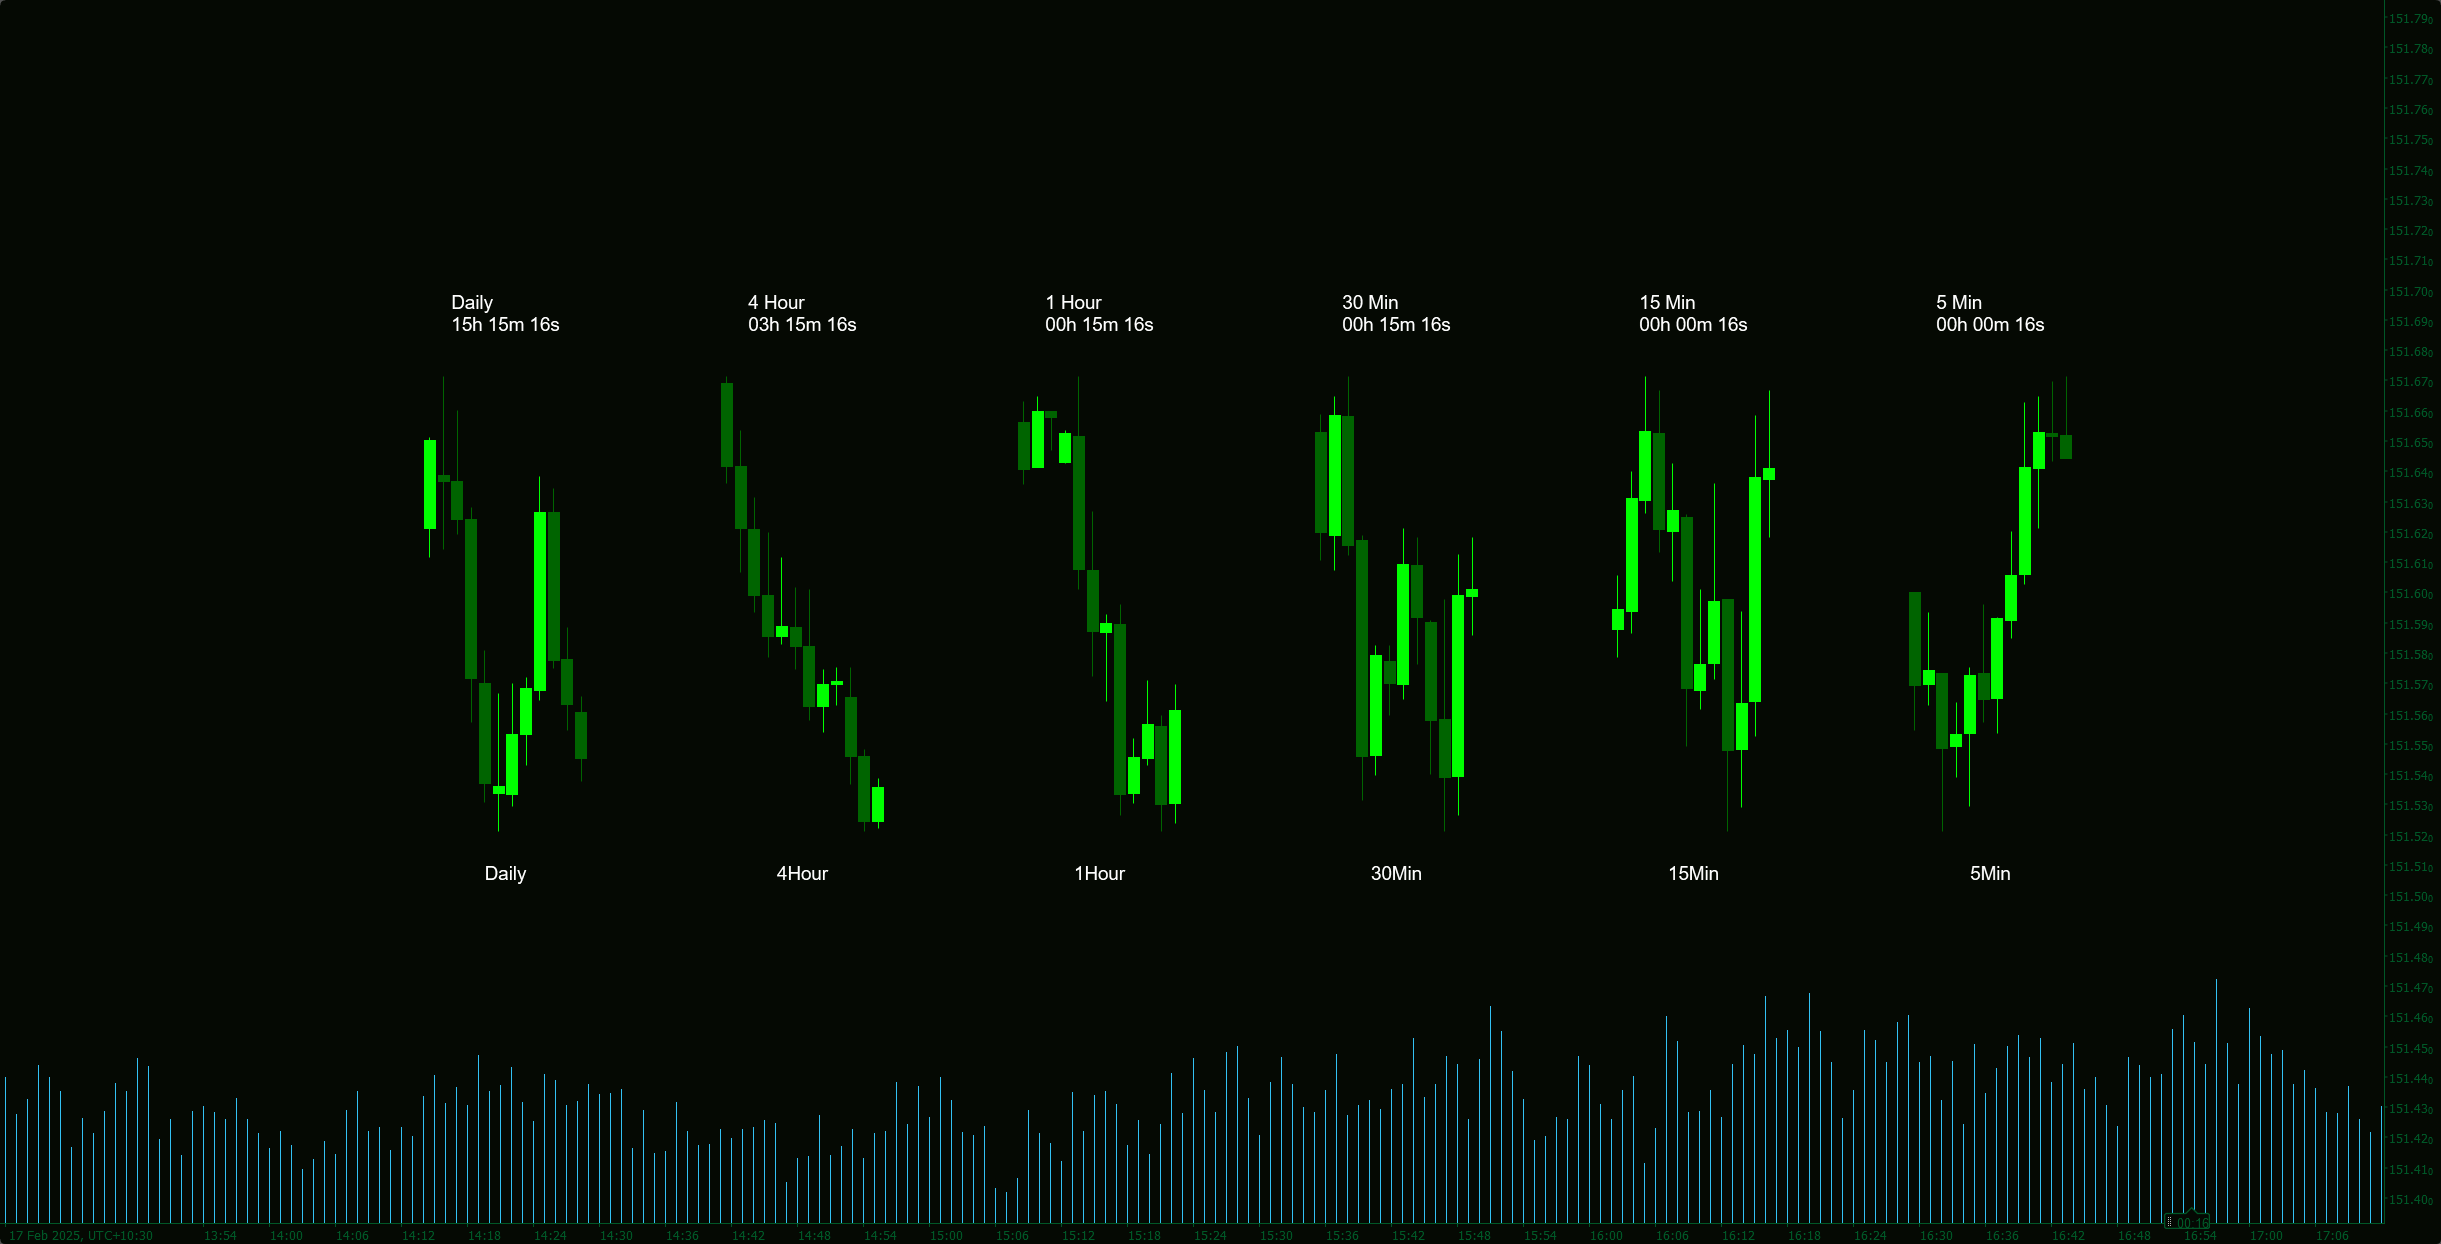
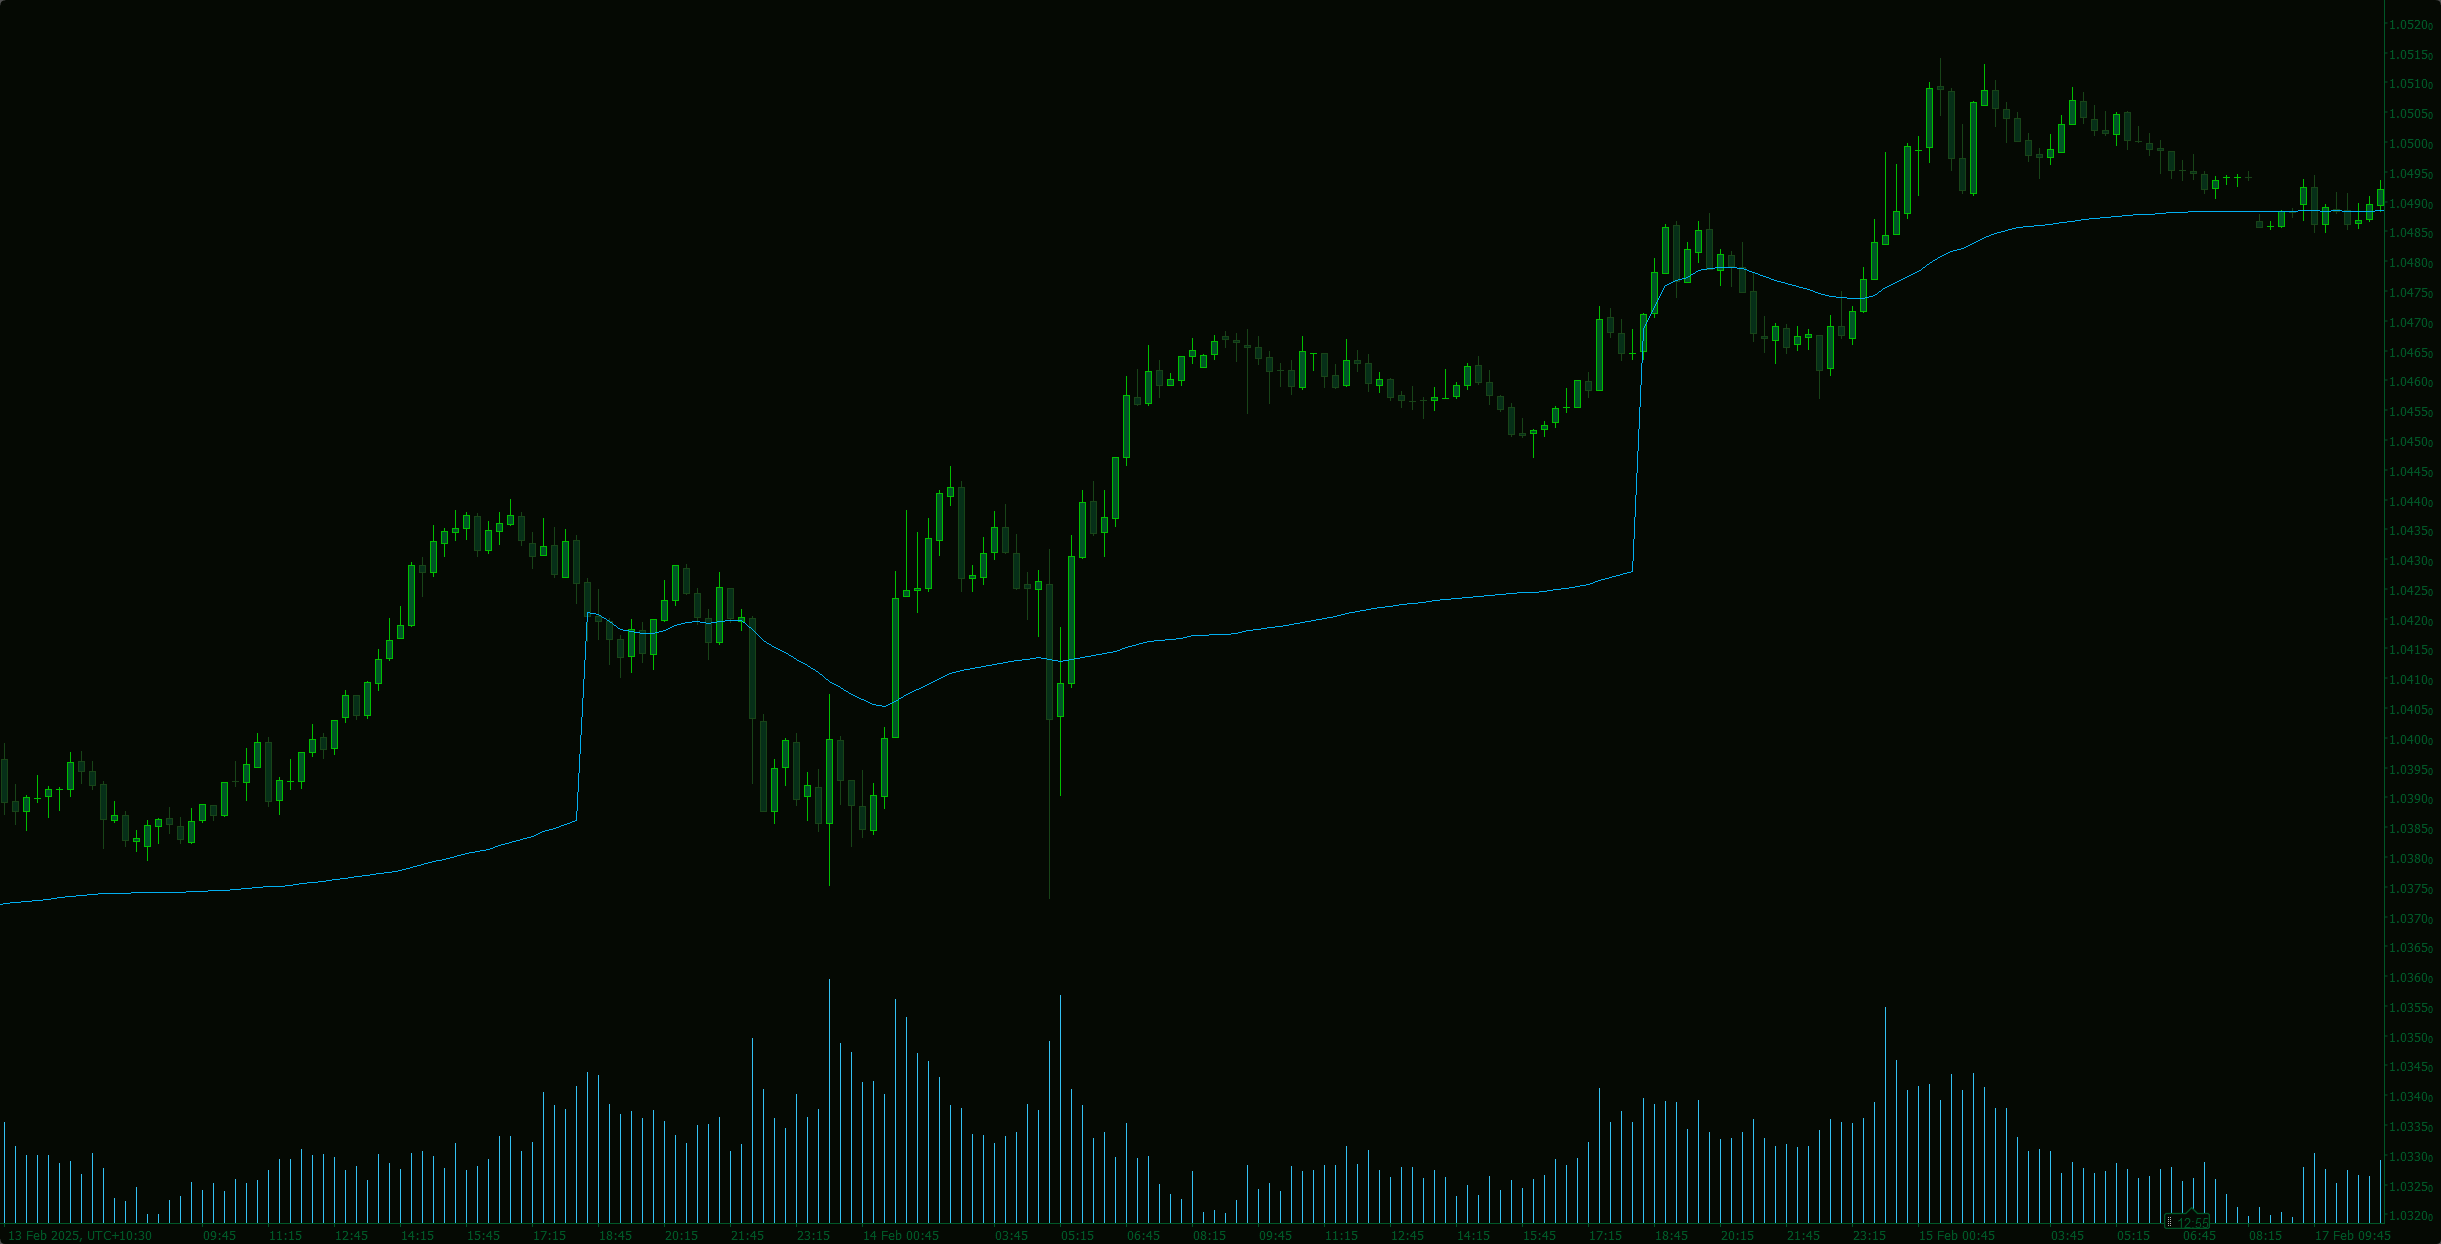
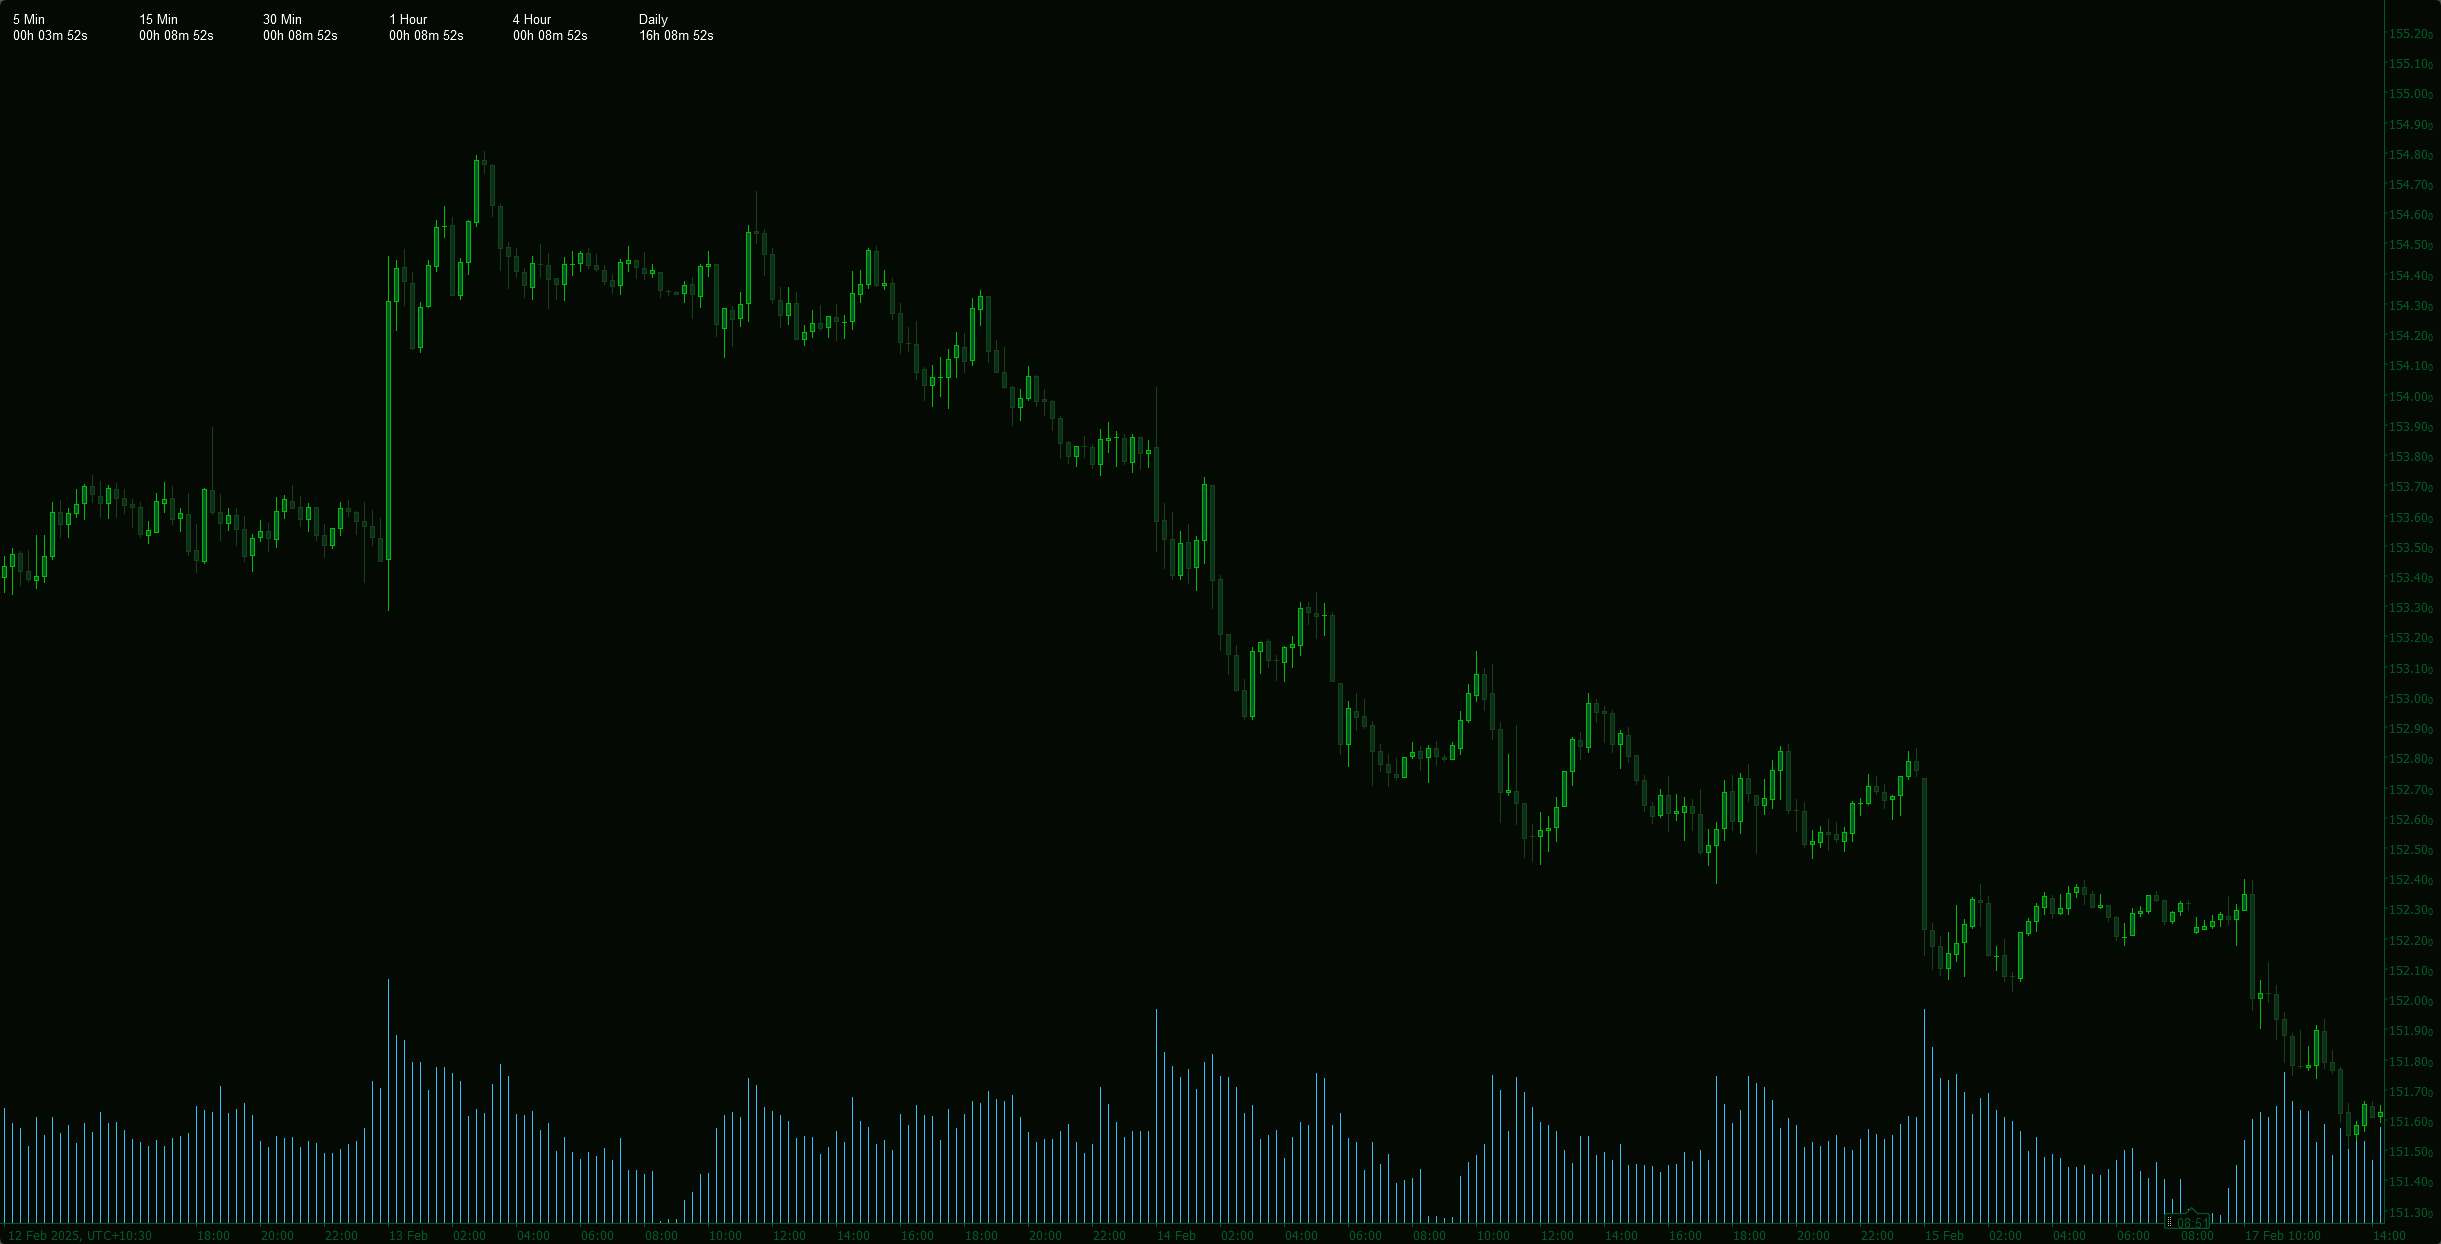
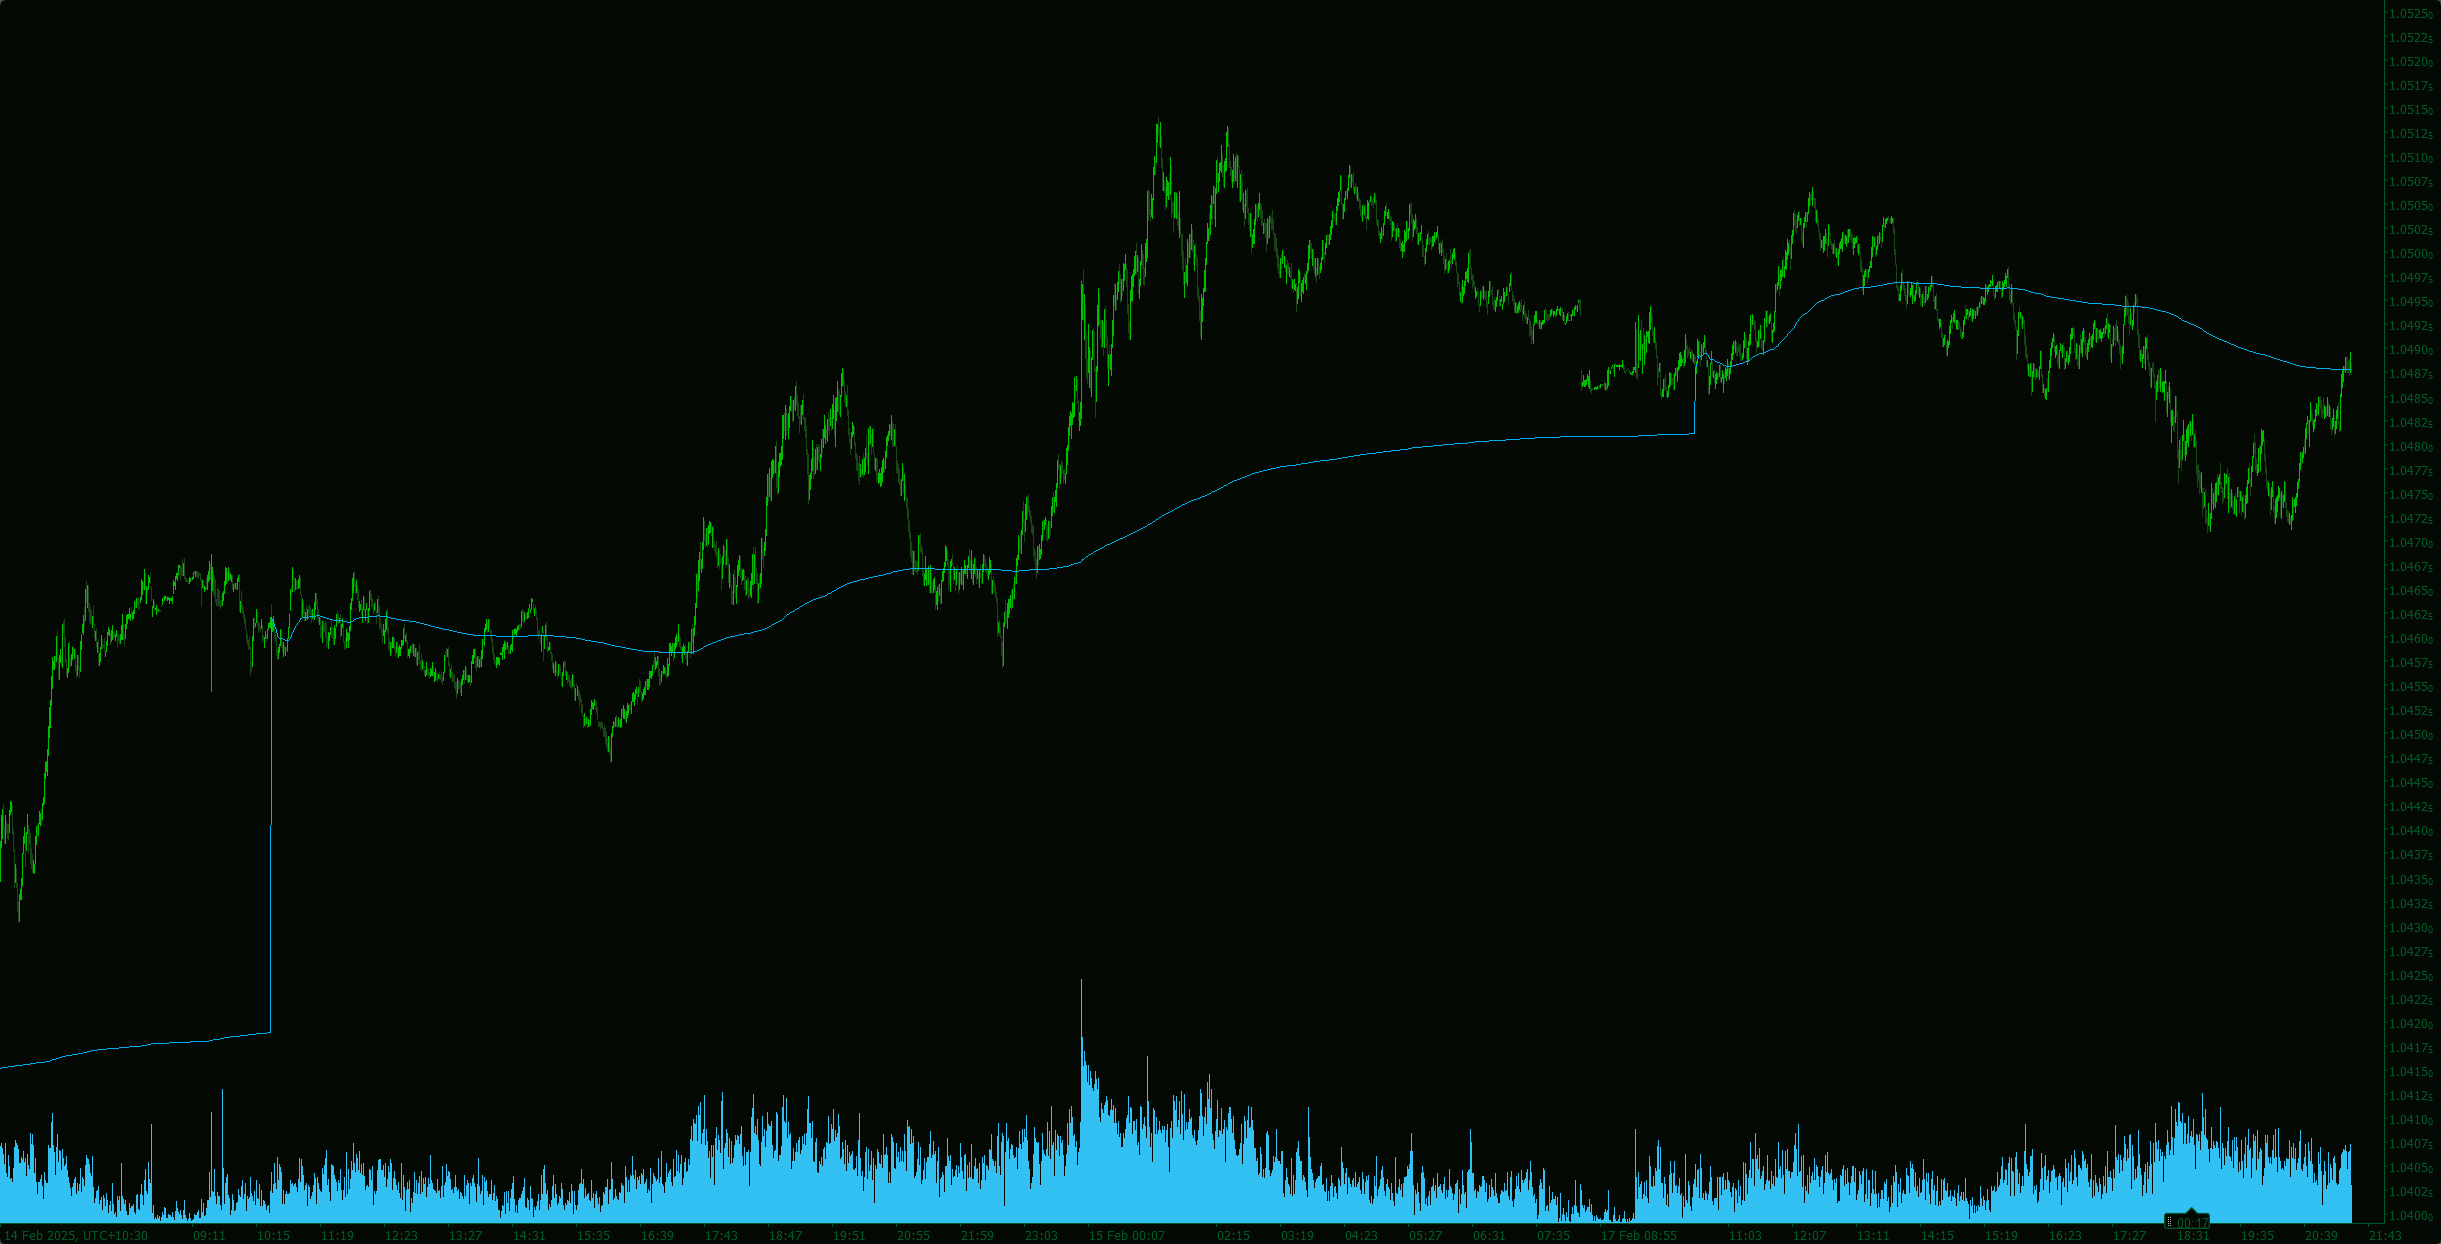
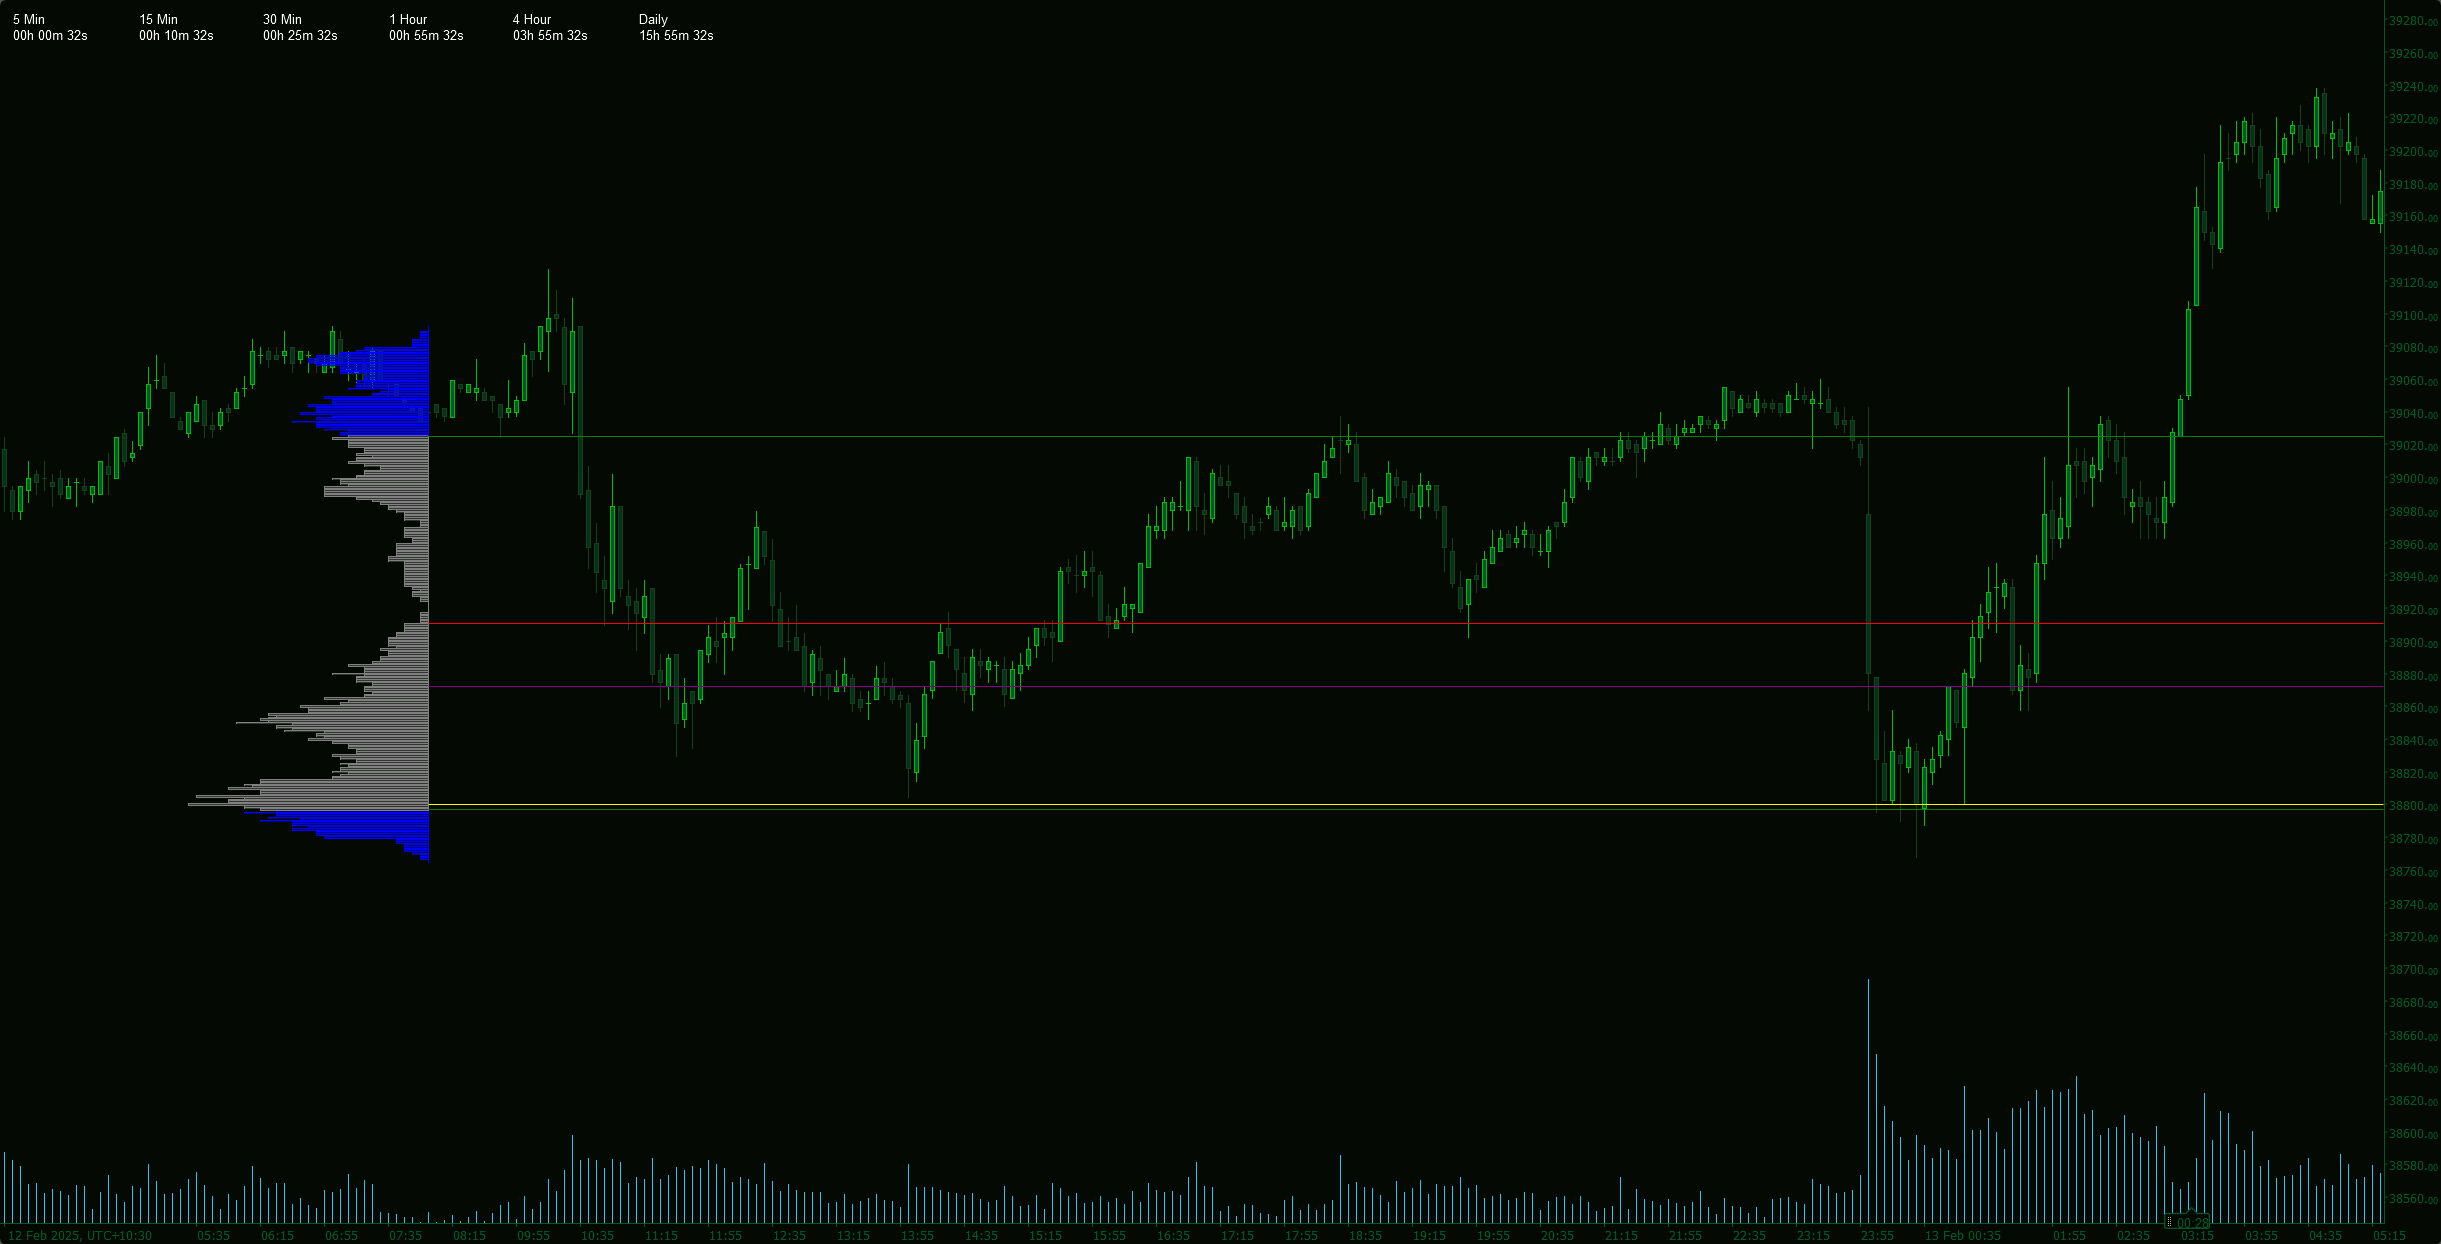
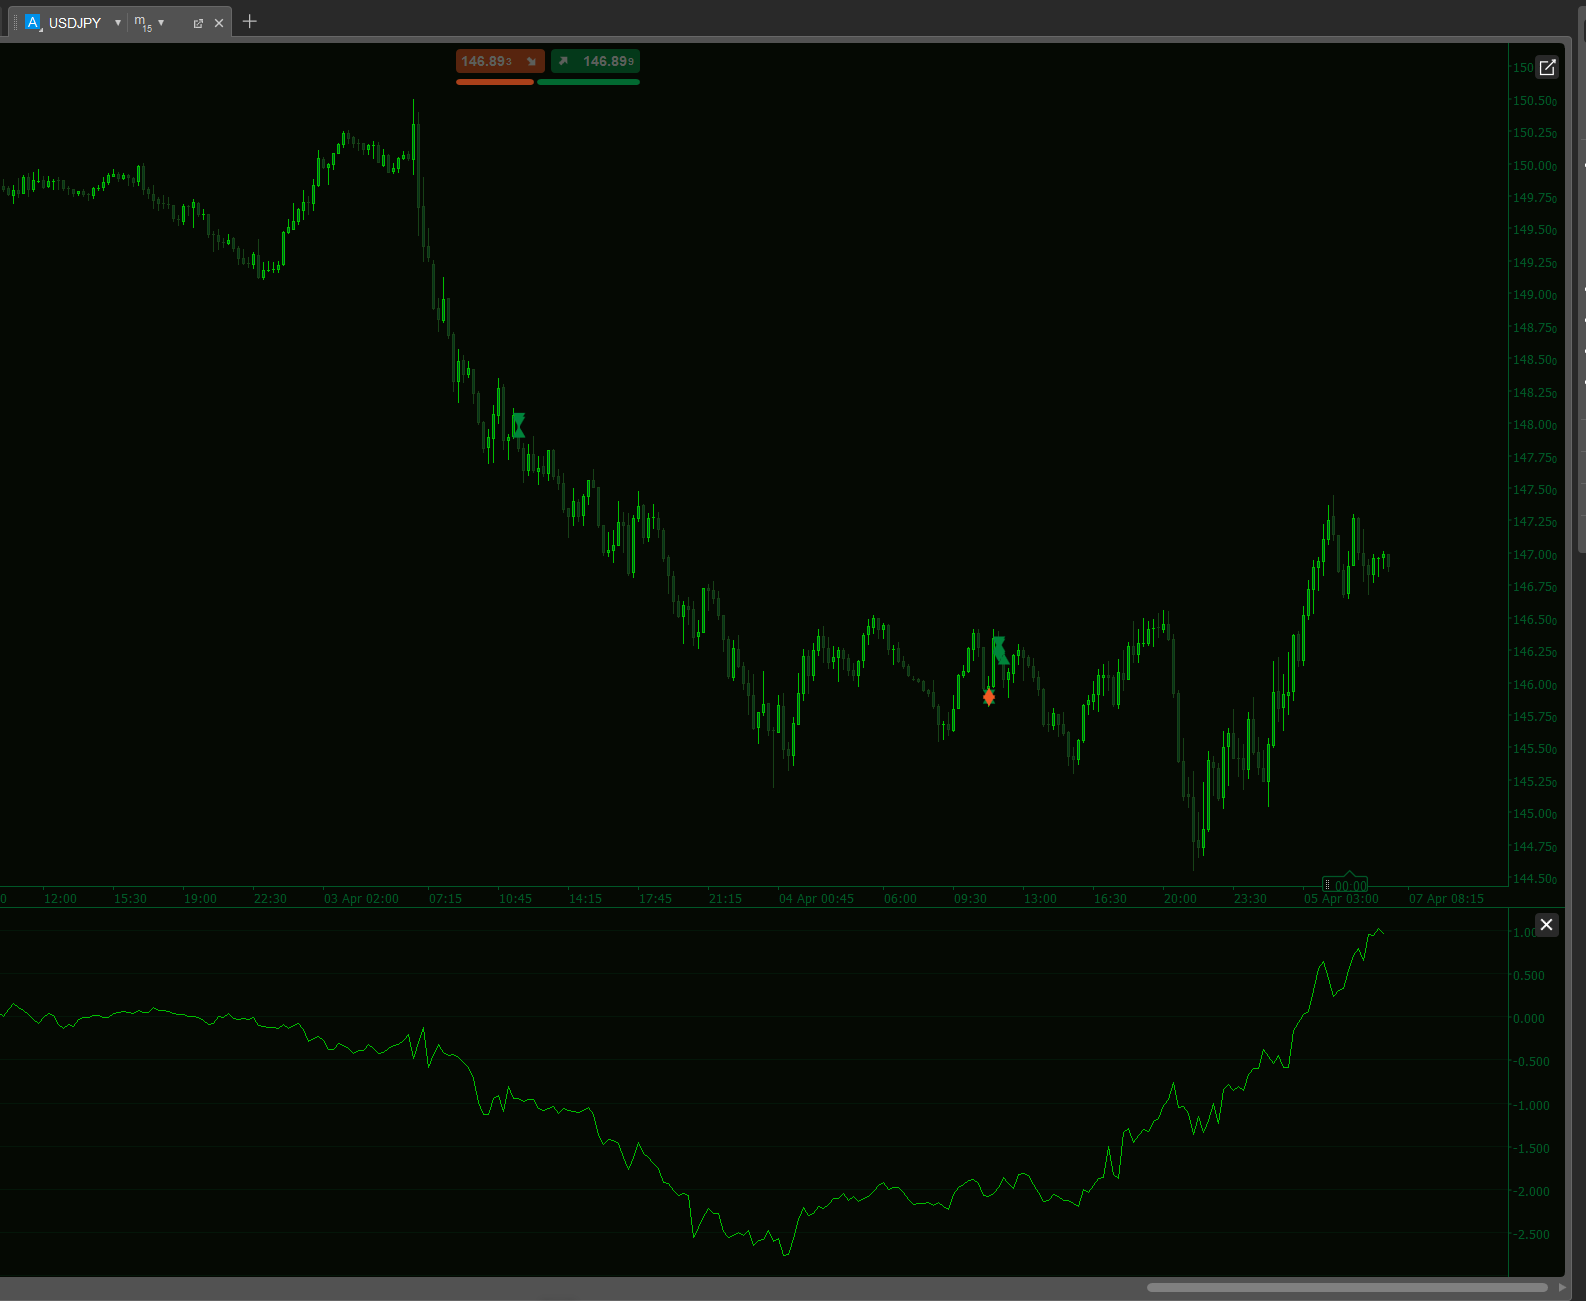
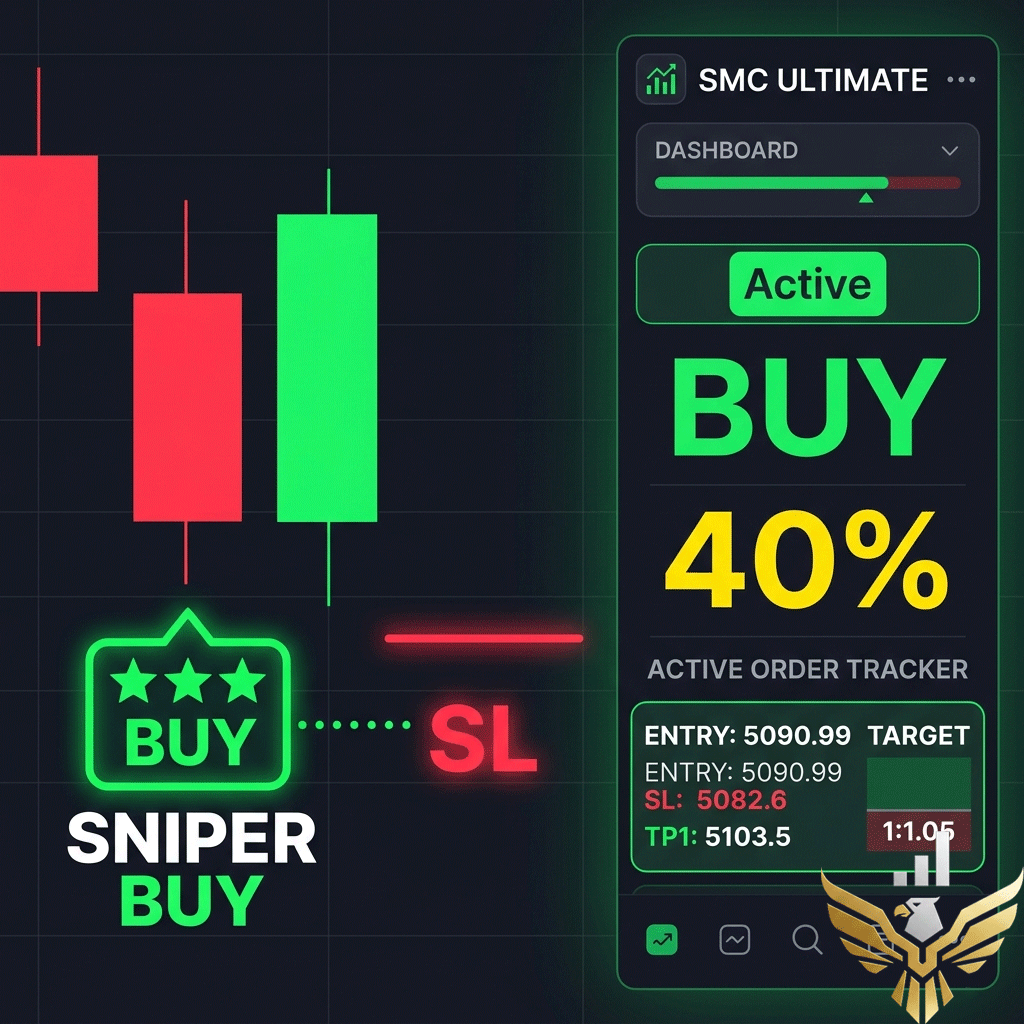
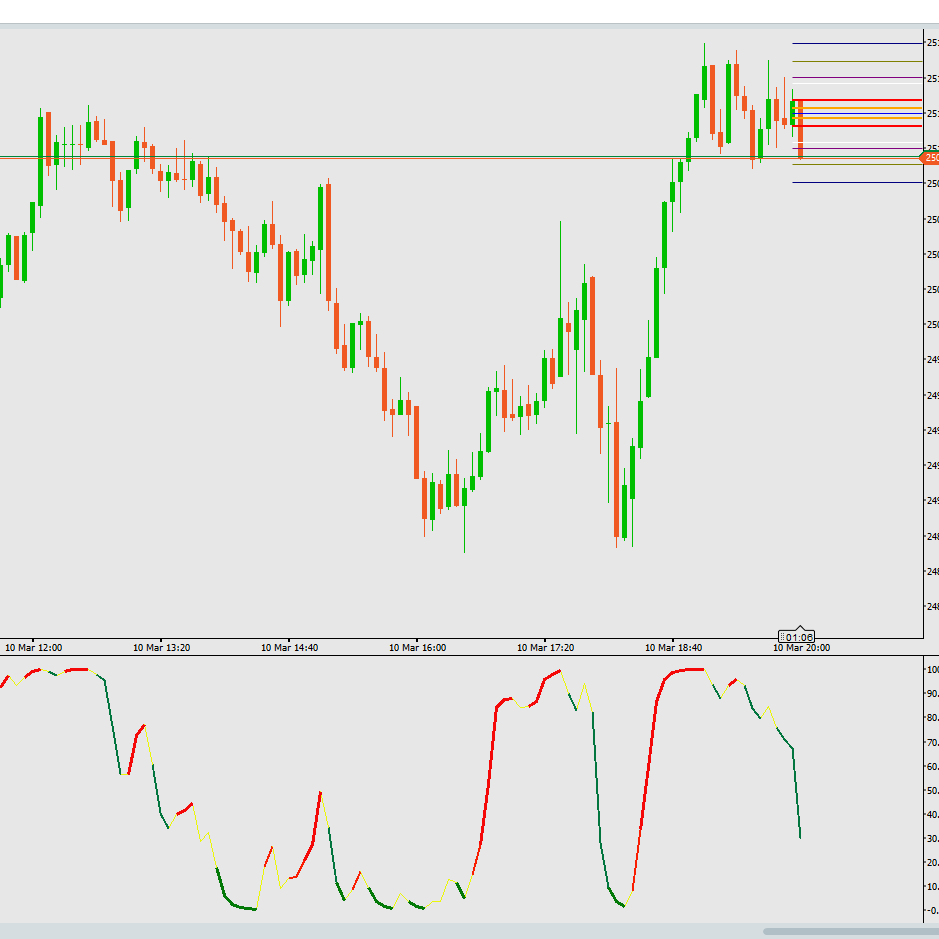
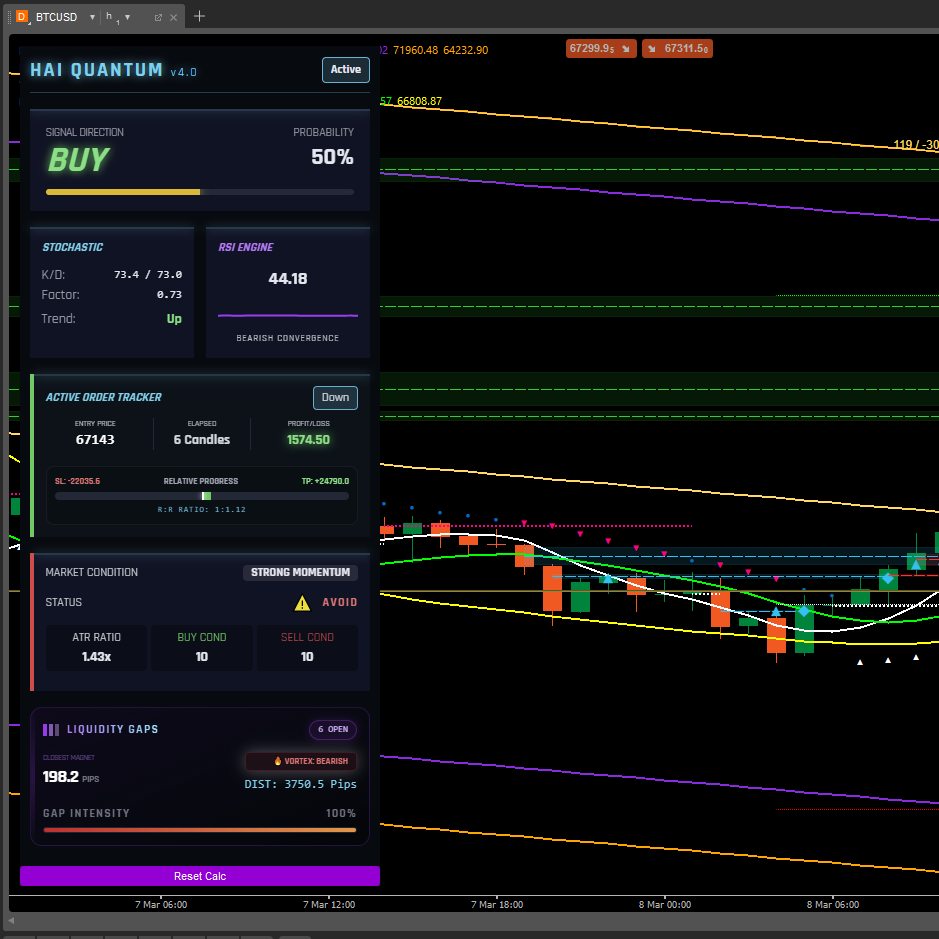
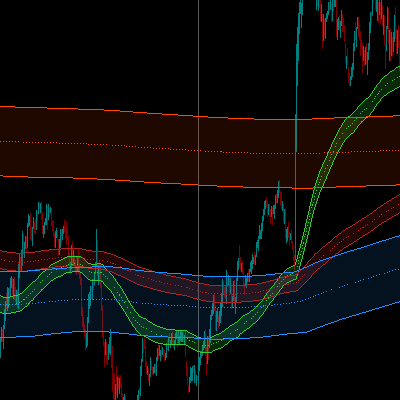
The Advanced CCI & EMA Indicator is a powerful trading tool that enhances trend analysis by combining the Commodity Channel Index (CCI) with 40 and 80 EMA logic. This sophisticated approach generates arrows that indicate potential price movement, helping traders identify high-probability trade opportunities.

Key Features:

0.0
Reviews: 0
Customer reviews
No reviews for this product yet. Already tried it? Be the first to tell others!
More from this author
Indicator
Indices
Stocks
Commodities
+2
Market Sessions - Free
Track major trading sessions (Tokyo, London, New York) with customizable colors and visual sessions on your chart.
Supply Demand V1-Premium
Auto-detect supply & demand zones, remove broken levels, and trade smarter with real-time alerts. Precision made simple.
Supply Demand - BasicV1
Supply and demand zones. They're important. Here's a free version to get you started!
MTF Candle Window - On Chart
The Multi-Timeframe Candle Indicator displays candles from multiple timeframes in one window, enhancing market analysis!
Market Sessions V2_NSC
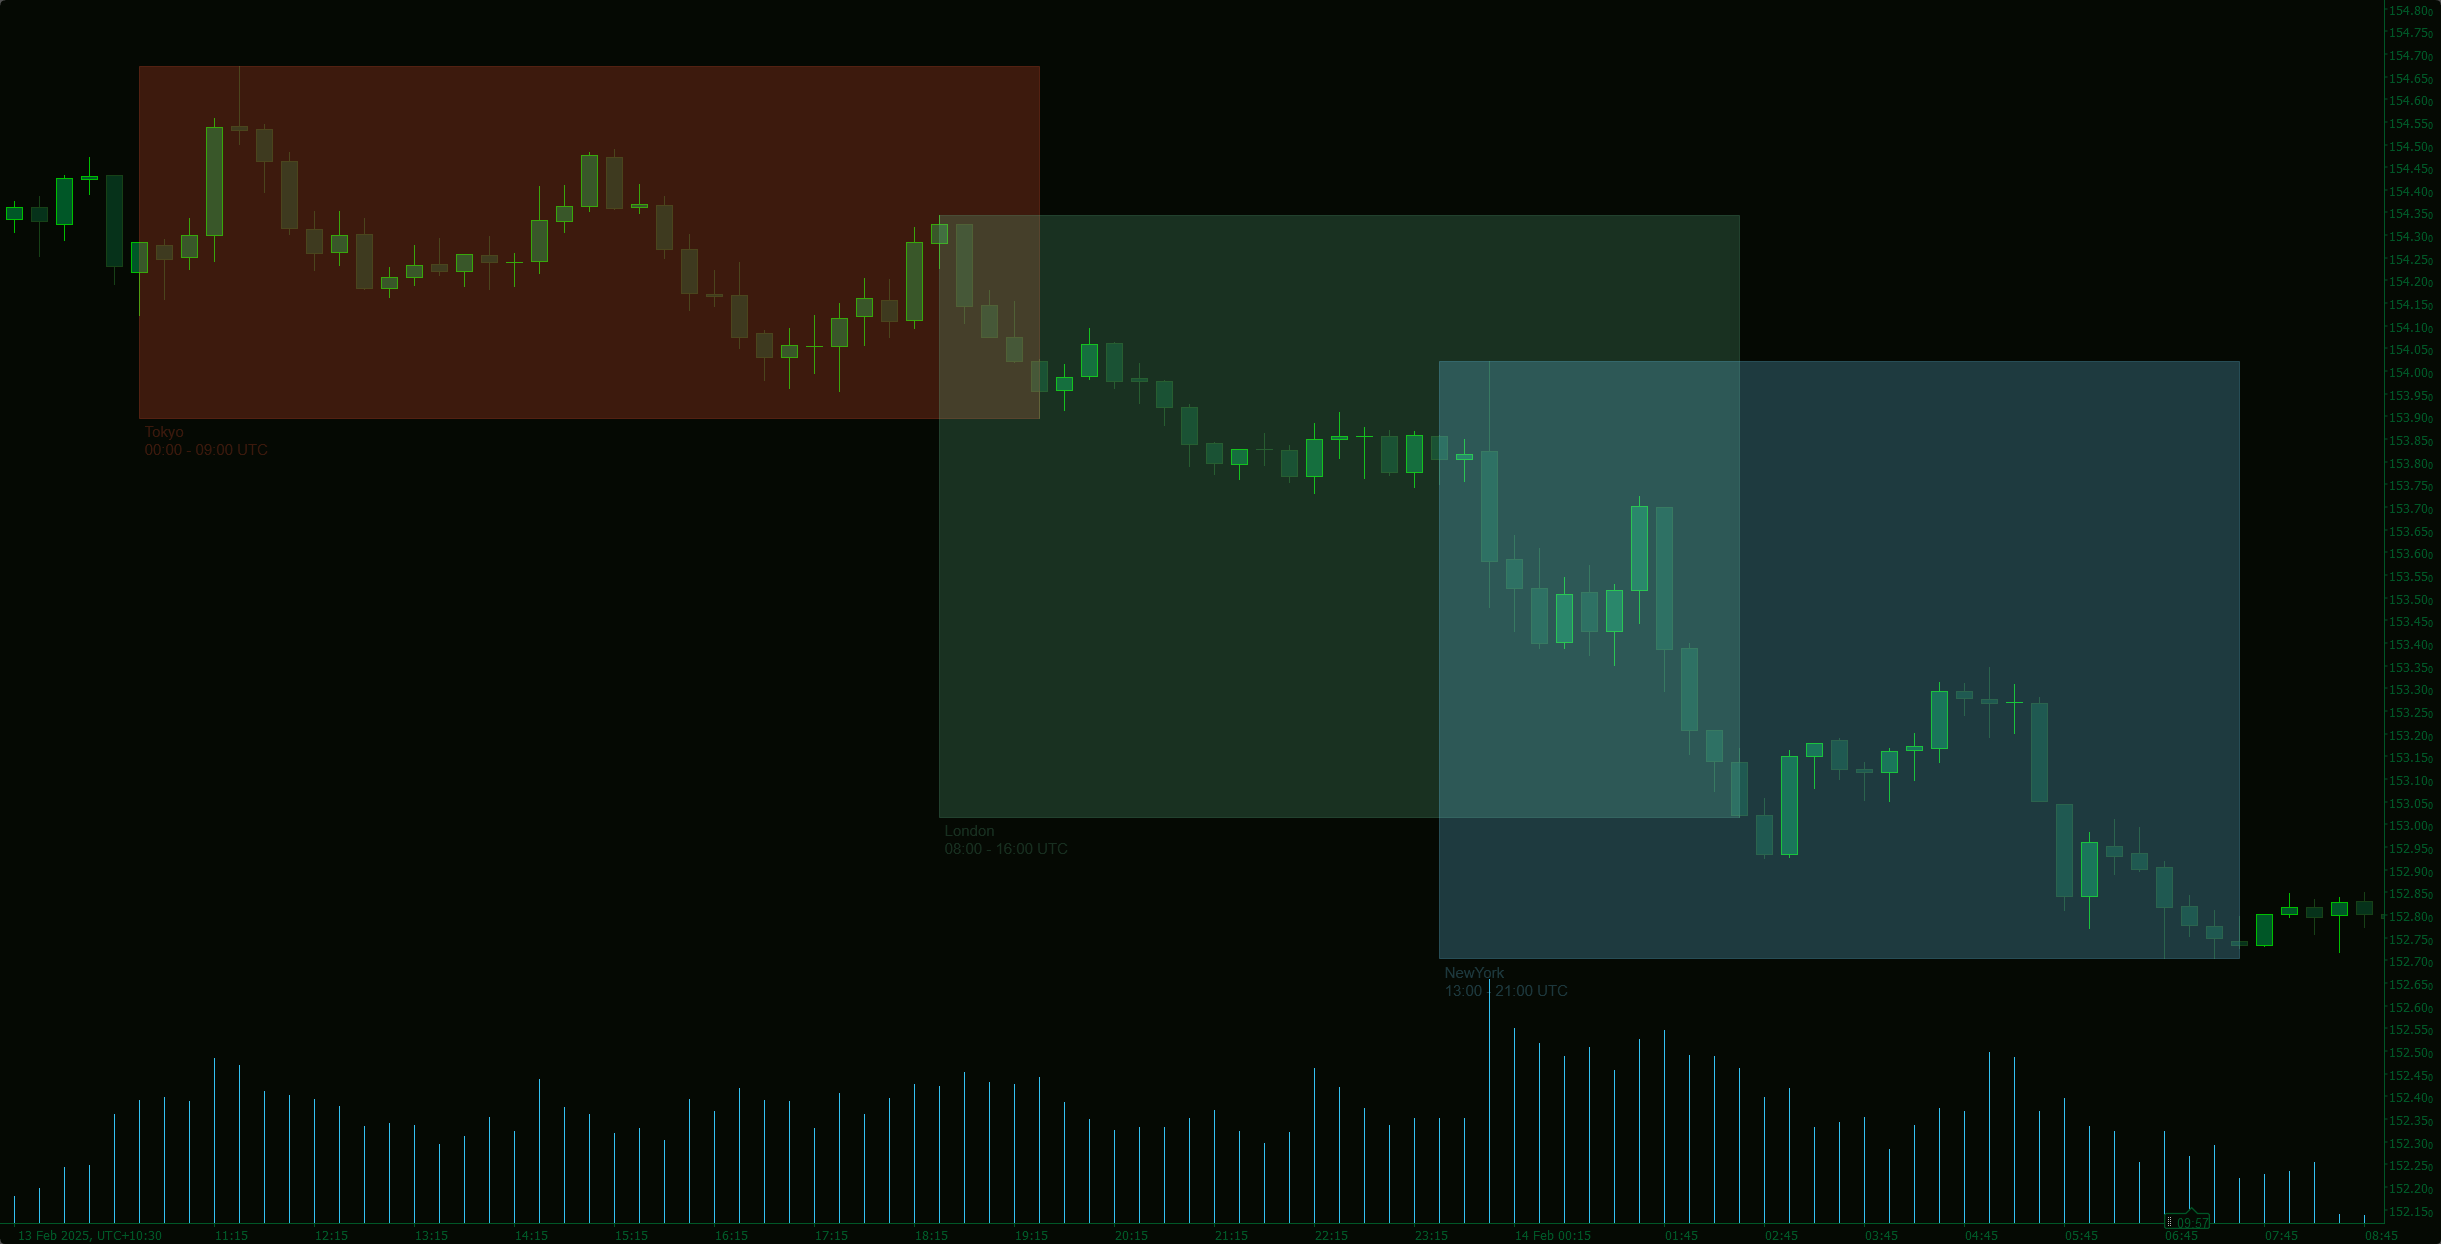
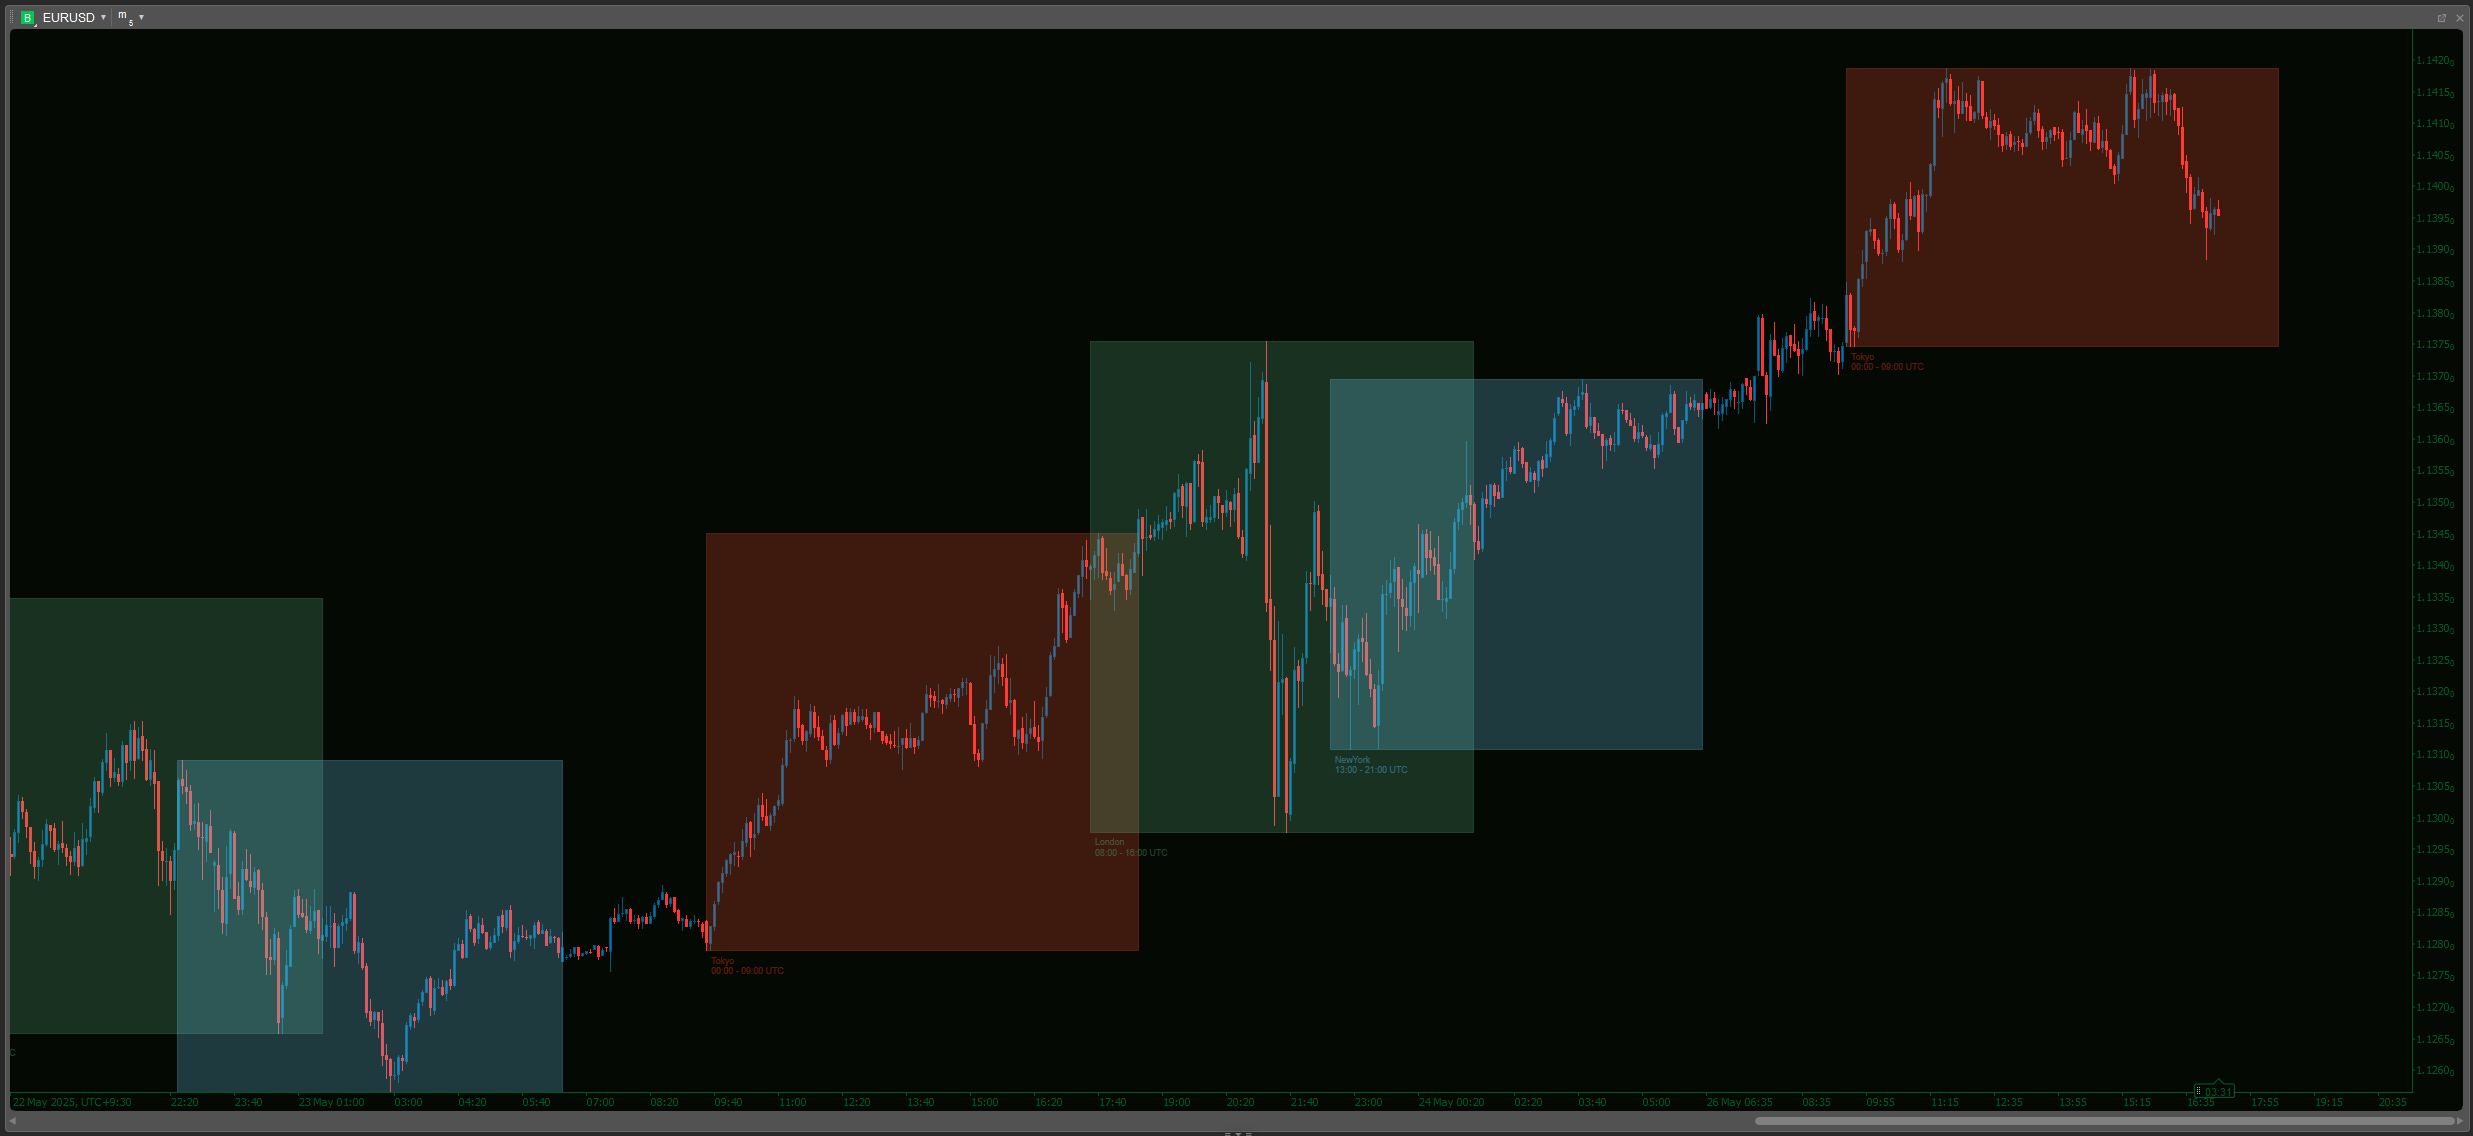
Market Session V2: Full Control. colors, history, session/text toggles, font size. Elevate your strategy!
Market Session V3_NSC
Version 3: Full control of session display including start and end times of all 3 sessions!
VWAP - London Open
VWAP Set to London Open
MTF Candle Countdown
Stay ahead with a real-time countdown to candle closes on all key timeframes: 5m, 15m, 30m, 1H, 4H, and Daily.
VWAP Tokyo Open
VWAP Set to Tokyo Open
Volume Profile Triple Line - POC Median Mode
The Advanced Volume Profile Indicator calculates POC, Median, and Mode, revealing key price levels for smarter trading.
Indicator
Indices
Forex
Signal
+2
US Dollar Index
US Dollar Index
Indicator
NZDUSD
Forex
USDJPY
+1
8 Currencies_NSC
RCS: 8 majors! AUD,USD,EUR,JPY,GBP,CAD,CHF,NZD. Find how strong each currency is relatively and trade smarter!
Open Trade PipsV1
This indicator tracks the unrealised amount of pips in your open positions.
Commodity Channel Index Smoothed w Alerts_NSC
Smoothed CCI alerts! Audio & arrow signals for +/-100 crosses. Custom sounds & arrow filters. Precision trading!
Open Trade ProfitV1
A simple indicator that tracks the value of your open trades in pips.
Supply Demand Premium V2_NSC
The long awaited new and improved Supply Demand Premium V2 indicator. Unlock greater trading opportunities now!
Indicator
Indices
Forex
EURUSD
+1
DXY w HMA
DXY HMA Indicator
Indicator
Signal
USDJPY
On Balance Volume USD - Combined
See USD demand in one line—Composite OBV fuses six major FX pairs into a clear momentum gauge.
You may also like
Indicator
Indices
Commodities
Stocks
+2
Moving Averages Suite
28-method MA library in one indicator — from classic EMAs to adaptive & zero-lag variants.
Indicator
RSI
Breakout
Supertrend
+1
ZScore
Z-Score measures price deviation from its average, helping identify extremes, trends, and trading opportunities ........
DMI MONDAY ZONES v2.1
Marks Monday's OPEN,HIGH & LOW. These are areas of support and resistance for the week.
Candlestick Patterns - Special Candles
Boost your trading with Candlestick Patterns for cTrader – auto-detect key signals for smarter, faster decisions!
Indicator
Signal
dark-cloud
The Dark Cloud Cover indicator detects a bearish reversal pattern, marking key candles and confirming signals based on v
Indicator
NAS100
NZDUSD
Breakout
+12
Multi_TF Candlestick Chart Overlay
Perfect for traders who demand a clear overview of multiple timeframes at a glance.
Indicator
Scalping
Kaufman Adaptive MA with Trend Vision
Adaptive KAMA: fast in trend, slow in noise — with color-coded market state visualization.
Indicator
RSI
Breakout
Lozano Price Action
LPA simplifies trading by coloring candles with volume data and RSI levels for trend and reversal insights.
Indicator
NAS100
NZDUSD
XAUUSD
+10
Moving Average PRO
Customize your Moving Average! Choose any timeframe and price source for precision and flexibility in your analysis.
Indicator
Grid
Breakout
XAUUSD
+10
Ultimate Trend ADX
Download Ultimate Trend ADX today and experience a smarter way to track market trends completely free on ctrader
IR Multi Data
show symbol and time fram, daily net profit percent, daily net profit, and spread ln your chart. consider that timezone
JMA-Like
JMA-like is a highly responsive and ultra-smooth moving average designed to replicate the behavior of the original JMA!
PriceLevels
Displays the previous day's, last week's, and last month's highest and lowest price levels on your chart.
MTF Candles
Multi Timeframe Candle drawing. Draw Any candles from any timeframe on your chart :-)
Reversal Probability Engine
Detecting reversal zones + multidimensional mapping of support and resistance "Golden Levels.
Indicator
Indices
Commodities
Forex
Institutional FVG Zones MTF with Confluence
Professional Fair Value Gaps with multitimeframe spot on
Indicator
NAS100
NZDUSD
XAUUSD
+12
QQE Qualitative Quantity Estimation
Unlock trading precision with QQE! Dual QQE indicators with a Bollinger Bands zero line provide clear buy/sell signals.
MTF Candle Countdown
Stay ahead with a real-time countdown to candle closes on all key timeframes: 5m, 15m, 30m, 1H, 4H, and Daily.