
Описание
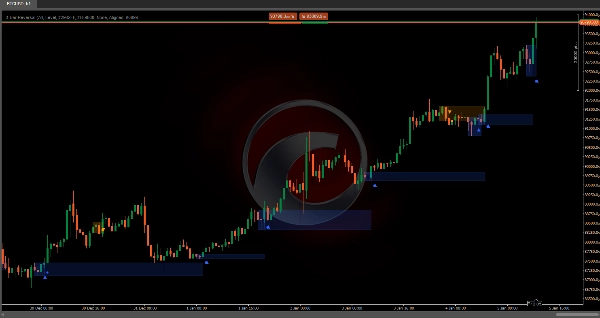
3-Bar Reversal
📊 ЧТО ЭТО?
Индикатор 3-Bar Reversal — это технический индикатор, который выявляет специфические паттерны разворота, образованные ровно тремя последовательными свечами. Этот классический паттерн сигнализирует о возможных изменениях направления цены через четкую визуальную структуру: свеча тренда, свеча истощения и свеча разворота.
🎯 ДЛЯ ЧЕГО ЭТО НУЖНО?
Этот индикатор помогает трейдерам:
- Обнаруживать бычьи и медвежьи развороты с 3-свечной структурой
- Фильтровать ложные сигналы через настраиваемое подтверждение тренда
- Определять зоны поддержки и сопротивления на основе подтвержденных паттернов
- Визуализировать торговые возможности с помощью интуитивных маркеров на графике
- Торговать развороты с высокой вероятностью на любом таймфрейме
🔍 КАК ЭТО РАБОТАЕТ?
Бычий паттерн (3-Bar Bullish Reversal)
Структура из трех свечей:
- Свеча 1 (медвежья): Закрытие ниже открытия — подтверждает давление продавцов
- Свеча 2 (медвежье истощение): Формирует новые минимумы И новые максимумы ниже свечи 1, с медвежьим закрытием — сигнал капитуляции ⚠️
- Свеча 3 (бычий разворот): Закрытие выше открытия И максимум выше максимума свечи 1 — подтверждает смену контроля ✅
Медвежий паттерн (3-Bar Bearish Reversal)
Обратная структура:
- Свеча 1 (бычья): Закрытие выше открытия — подтверждает давление покупателей
- Свеча 2 (бычье расширение): Формирует новые максимумы И новые минимумы выше свечи 1, с бычьим закрытием — сигнал перекупленности ⚠️
- Свеча 3 (медвежий разворот): Закрытие ниже открытия И минимум ниже минимума свечи 1 — подтверждает смену контроля ✅
Система визуального управления (машина состояний)
Индикатор обрабатывает каждый паттерн в три последовательных фазы:
ФАЗА 1 - ОБНАРУЖЕНИЕ ПАТТЕРНА: 🔍
- Определяется полная 3-свечная структура
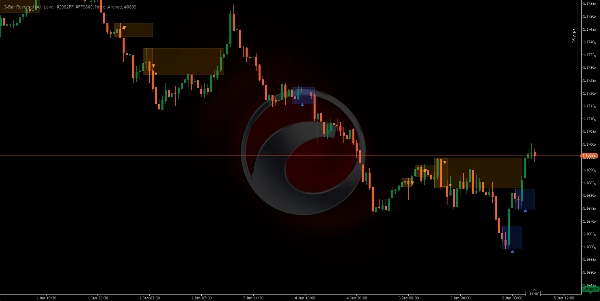
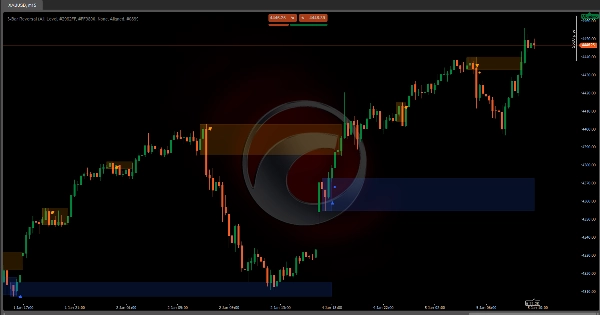
- Появляется треугольный индикатор (▲ бычий / ▼ медвежий) на третьей свече
- Рисуется полупрозрачный прямоугольник настройки, охватывающий:
-
- Бычий: От максимума свечи 1 до самого низкого минимума (свеча 2 или 3)
- Медвежий: От минимума свечи 1 до самого высокого максимума (свеча 2 или 3)
- Этот прямоугольник обозначает "зону боя", где произошел разворот
ФАЗА 2 - ПОДТВЕРЖДЕНИЕ ИЛИ ОТМЕНА: ⏳
Система ожидает следующую свечу после паттерна для его валидации:
Подтверждение бычьего разворота: ✅
- Закрытие следующей свечи должно превысить максимум свечи 1 (потолок прямоугольника)
- Появляется сплошная точка (●), обозначающая подтверждение
- Прямоугольник становится активной зоной поддержки
Подтверждение медвежьего разворота: ✅
- Закрытие следующей свечи должно пробить минимум свечи 1 (пол прямоугольника)
- Появляется сплошная точка (●), обозначающая подтверждение
- Прямоугольник становится активной зоной сопротивления
Отмена: ❌
- Бычий разворот отменяется, если: закрытие ниже минимума прямоугольника ИЛИ появляется медвежий паттерн
- Медвежий разворот отменяется, если: закрытие выше максимума прямоугольника ИЛИ появляется бычий паттерн
- Прямоугольник перестает расширяться (паттерн умирает)
Ожидание расширения: ⏸️
- Если нет подтверждения или отмены, прямоугольник расширяется горизонтально свеча за свечой
ФАЗА 3 - АКТИВНАЯ ЗОНА ПОДДЕРЖКИ/СОПРОТИВЛЕНИЯ: 🎯
- После подтверждения зона расширяется вправо бесконечно
- Бычья зона: Остается активной, пока цена выше пола
- Медвежья зона: Остается активной, пока цена ниже потолка
- Зона деактивируется, когда цена полностью пробивает ее в противоположном направлении
⚙️ ОСНОВНАЯ НАСТРОЙКА
Режим паттерна
Управляет тем, какие вариации паттернов принимаются:
- Обычный: Принимает только когда свеча 3 закрывается ВНУТРИ диапазона свечи 1
-
- Бычий: Закрытие < максимум свечи 1 (умеренный разворот)
- Медвежий: Закрытие > минимум свечи 1 (умеренный разворот)
- Расширенный: Принимает только когда свеча 3 закрывается ВНЕ диапазона свечи 1 🔥
-
- Бычий: Закрытие > максимум свечи 1 (взрывной разворот)
- Медвежий: Закрытие < минимум свечи 1 (взрывной разворот)
- Все (Рекомендуется): Принимает оба типа без различий ⭐
Тип поддержки/сопротивления
- Уровень: Базовая функциональность линии (ограничена в этой версии)
- Зона: Рисует затенённые прямоугольники, обозначающие зоны поддержки/сопротивления после подтверждения 📦
- Нет: Нет зон поддержки/сопротивления, показываются только обнаруженные паттерны
Настраиваемые цвета 🎨
- Цвет бычьего разворота: Для треугольников, прямоугольников и бычьих зон (по умолчанию:
#2962FF- синий) - Цвет медвежьего разворота: Для треугольников, прямоугольников и медвежьих зон (по умолчанию:
#FF9800- оранжевый) - Цвет бычьего тренда: Для визуализации фильтра тренда (по умолчанию:
#089981- зеленый) - Цвет медвежьего тренда: Для визуализации фильтра тренда (по умолчанию:
#F23645- красный)
🔧 ФИЛЬТРЫ ТРЕНДА
Индикатор может фильтровать паттерны на основе общего направления тренда, используя четыре метода:
1. Облако скользящих средних ☁️
Использует две скользящие средние для определения тренда:
Параметры:
- Тип скользящей средней: Простая, экспоненциальная, Халл, взвешенная и др. (по умолчанию: Халл)
- Быстрый период: 50 (по умолчанию)
- Медленный период: 200 (по умолчанию)
Логика фильтра (Выравненная):
- Бычий тренд определяется, когда: Цена > Быстрая СС И Быстрая СС > Медленная СС ✅
- Медвежий тренд определяется, когда: Цена < Быстрая СС И Быстрая СС < Медленная СС ✅
- Показывает только бычьи паттерны в бычьем тренде и медвежьи паттерны в медвежьем тренде
Обратная логика (Противоположная):
- Инвертирует условия для захвата крупных контртрендовых разворотов
2. Supertrend 📈
Индикатор следования за трендом на основе волатильности (ATR):
Параметры:
- Период ATR: 10 (по умолчанию) — окно расчета волатильности
- Множитель: 3.0 (по умолчанию) — чувствительность индикатора
Логика:
- Вычисляет верхнюю и нижнюю границы с использованием ATR
- Цена выше Supertrend = бычий тренд 🟢
- Цена ниже Supertrend = медвежий тренд 🔴
- Фильтрует паттерны согласно настроенному выравниванию
3. Каналы Дончиана 📊
Использует экстремумы цены за период:
Параметры:
- Длина канала: 13 (по умолчанию)
Логика:
- Верхний канал = самый высокий максимум за N периодов
- Нижний канал = самый низкий минимум за N периодов
- Средняя точка = (верхний + нижний) / 2
- Цена выше средней точки = бычий тренд 🟢
- Цена ниже средней точки = медвежий тренд 🔴
4. Нет (Без фильтра) 🔓
Показывает ВСЕ обнаруженные 3-свечные паттерны без учета общего тренда. Полезно для:
- Рынков с ограниченным диапазоном
- Чистого анализа паттернов
- Торговли разворотами в любом контексте
Выравнивание тренда
Применяется, когда фильтр активен:
- Выравнено: Показывает только паттерны, которые СОГЛАСУЮТСЯ с определенным трендом ➡️
-
- Только бычьи паттерны в бычьем тренде
- Только медвежьи паттерны в медвежьем тренде
- Противоположно: Показывает только паттерны, которые ИДУТ ПРОТИВ определенного тренда 🔄
-
- Бычьи паттерны в медвежьем тренде (крупный разворот)
- Медвежьи паттерны в бычьем тренде (крупный разворот)
Сводка
It operates in three phases: pattern detection, confirmation or invalidation based on the next candle's behavior, and establishing active support or resistance zones that extend while price respects them. The indicator supports configurable pattern modes (Normal, Enhanced, or All) to control acceptance criteria for reversals.
Trend filtering is available through four methods—Moving Average Cloud, Supertrend, Donchian Channels, or no filter—allowing users to align pattern signals with overall market trends or capture counter-trend reversals. Confirmed reversal zones are displayed as shaded rectangles or levels, customizable in color for bullish and bearish signals, trend filters, and zones.
This tool is designed for use on any timeframe and across various markets, including forex pairs (EURUSD, GBPUSD, USDJPY, NZDUSD), commodities (XAUUSD), indices (NAS100), and cryptocurrencies (BTCUSD). It aids traders in detecting high-probability reversals, filtering false signals, and identifying support and resistance zones with clear visual markers.


