如果你曾在外汇市场待过一段时间,你就会知道要弄清楚到底是哪种货币真正推动了行情的变化是多么棘手,尤其是当你同时观察多个货币对时。我经常希望有一种更清晰的方法来查看主要货币的单独表现,而不仅仅是某个货币对的表现。
这就是为什么我开发了这个 相对货币强度指标。
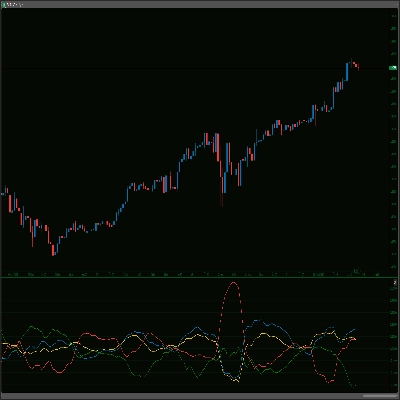
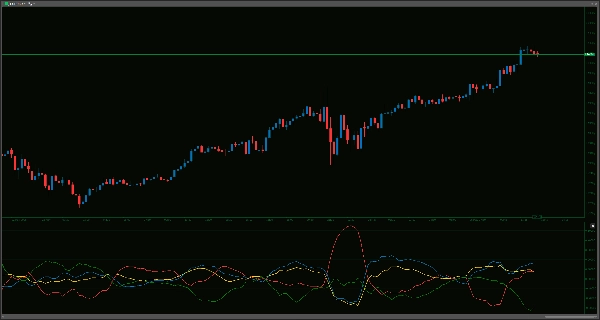
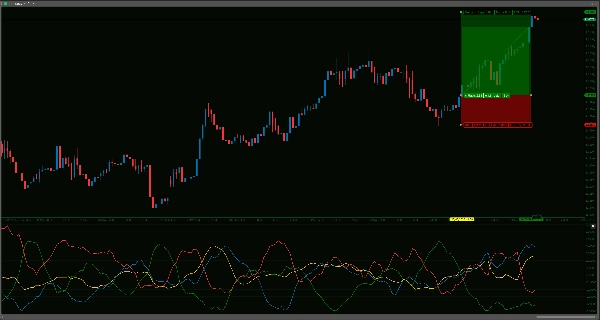
这个想法非常简单:它旨在衡量并显示澳元、美元、欧元和日元的相对强度。它通过观察这些货币相对于其他货币篮子的表现(具体是通过AUDUSD、AUDEUR、AUDJPY、EURUSD、EURJPY和USDJPY等货币对)在你可以定义的回溯期内的表现来实现这一点。
我发现它有用的地方,以及它可能如何帮助你:
- 更好的货币对选择: 有时,比如看到澳元持续走强而日元走弱,可以促使你更仔细地关注AUD/JPY。这有助于筛选你关注的货币对。
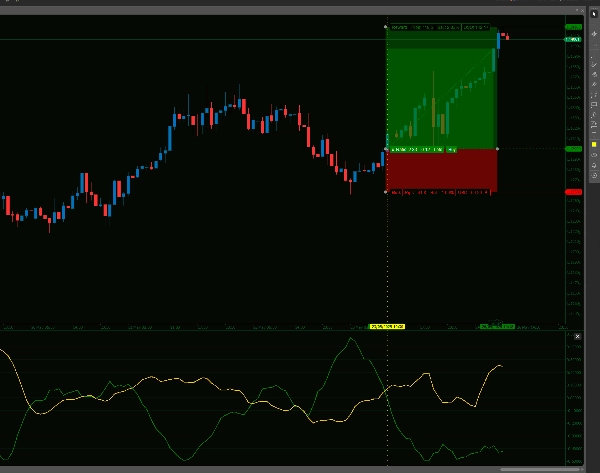
- 理解市场驱动因素: 当像EUR/USD这样的货币对波动时,是主要由于美元走强还是欧元走弱?这个指标可以为你提供一些视角,帮助你理解更广泛的资金流向。
- 根据你的风格定制:
-
- 你可以调整
LookbackPeriod(默认是14根K线)。较短的周期响应更快,较长的周期则显示更稳定的趋势。 - 还有一个
SmoothingPeriod(默认是5根K线),它对强度线应用指数移动平均(EMA)。如果你喜欢更平滑的输出,这可以帮助减少一些噪音。如果你想要原始计算结果,只需将平滑设置为0。
- 你可以调整
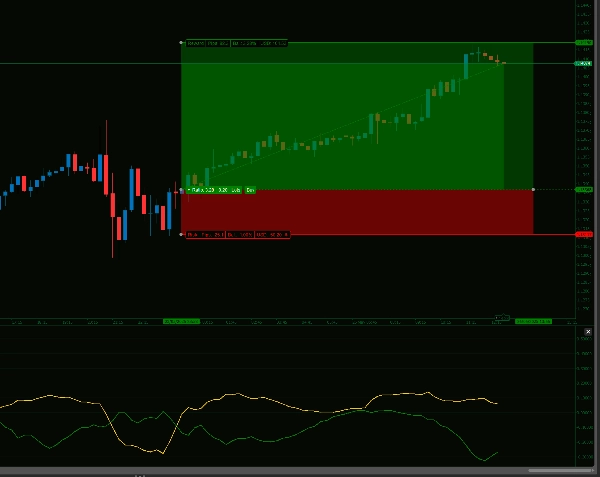
- 清晰的视觉效果: 它将每种货币的强度绘制为独立的线条,显示在主图下方的单独窗口中,因此不会干扰你的价格走势。
- 可靠的数据: 计算基于每根K线的收盘价,因此线条在K线完成后不会重绘或改变。
没有任何指标是万能的,这个也不例外。它只是一个工具。我发现它是我分析过程中的有用部分,特别是在确认想法或快速了解主要货币动态时。
提醒一下,由于该指标需要拉取所有货币对的数据以有效计算真实的相对强度,如果你同时使用其他资源消耗较大的指标,这个指标可能会占用较多资源,有时会导致Ctrader崩溃。过去一个月我在使用一台5年旧的电脑时曾遇到过一次,但不应经常发生。如果发生了,只需刷新窗口时间框架或简单调整周期设置(加减1)即可强制重新计算,指标将重新显示。
--------------------------
欢迎查看我的其他指标!
https://ctrader.com/products/1181
https://ctrader.com/products/1182
https://ctrader.com/products/1180
https://ctrader.com/products/1015
https://ctrader.com/products/555
https://ctrader.com/products/553
https://ctrader.com/products/554
https://ctrader.com/products/552
https://ctrader.com/products/557
https://ctrader.com/products/845
https://ctrader.com/products/848
https://ctrader.com/products/847
https://ctrader.com/products/846
https://ctrader.com/products/551
https://ctrader.com/products/574
https://ctrader.com/products/573
https://ctrader.com/products/556
https://ctrader.com/products/558
5 | 67 % | |
4 | 33 % | |
3 | 0 % | |
2 | 0 % | |
1 | 0 % |


!["[Hamster-Coder] Moving Average MTF" 标识](https://cdn.ctrader.com/image/webp/b11b98b1-194d-4b8e-b00e-d611826ad159_31226)


