present
注册即可在首次购物时获得 $50 优惠
Trading product for Kumo Forge Pro 指标 Key Levels RSI, image 1
Kumo Forge Pro
指标
版本 1.0, Sep 2026
Windows 版、Mac 版
Trading product for Kumo Forge Pro 指标 Key Levels RSI, image 2
Trading product for Kumo Forge Pro 指标 Key Levels RSI, image 3
Trading product for Kumo Forge Pro 指标 Key Levels RSI, image 4
Trading product for Kumo Forge Pro 指标 Key Levels RSI, image 5
Trading product for Kumo Forge Pro 指标 Key Levels RSI, image 6
Trading product for Kumo Forge Pro 指标 Key Levels RSI, image 7
Trading product for Kumo Forge Pro 指标 Key Levels RSI, image 8
Trading product for Kumo Forge Pro 指标 Key Levels RSI, image 9
Trading product for Kumo Forge Pro 指标 Key Levels RSI, image 10
Trading product for Kumo Forge Pro 指标 Key Levels RSI, image 11

说明

KUMO FORGE PRO


An Ichimoku system whose periods adapt to volatility, with every signal scored out of 100 before it is

drawn.


WHAT IT PUTS ON YOUR CHART


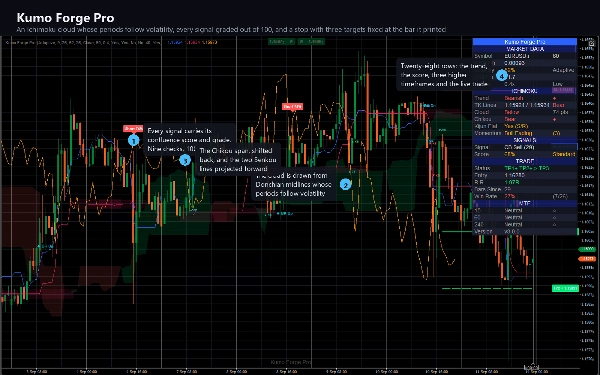
The full Ichimoku picture - Tenkan-Sen, Kijun-Sen, the Kumo cloud and the Chikou span - with one

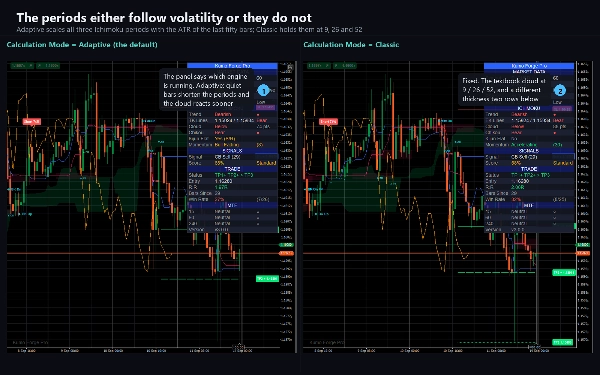
difference from the textbook version: in Adaptive mode the three periods stretch and compress with

measured volatility, so the cloud reacts faster in a fast market and slower in a quiet one. Classic

mode gives you the fixed 9 / 26 / 52 if you prefer it.


On top of that:


- Signal plates reading Long or Short with the confluence score on them.

- Kumo breakout and retest markers, Kijun-bounce and cloud-edge-bounce markers, and Chikou-break markers.

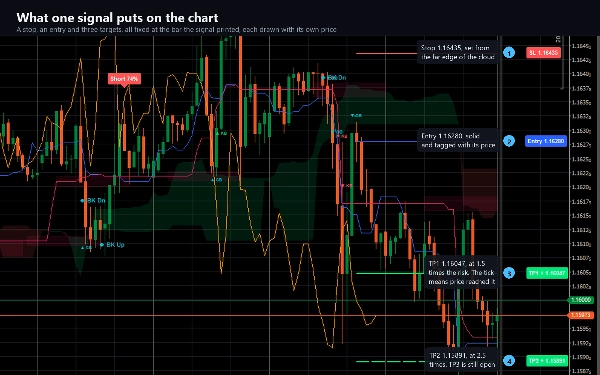
- A complete trade drawing after every signal: the entry, a stop, and three take-profit levels, each a

labelled line carrying its own price.

- Support and resistance zones drawn wherever the Kijun-Sen goes flat.

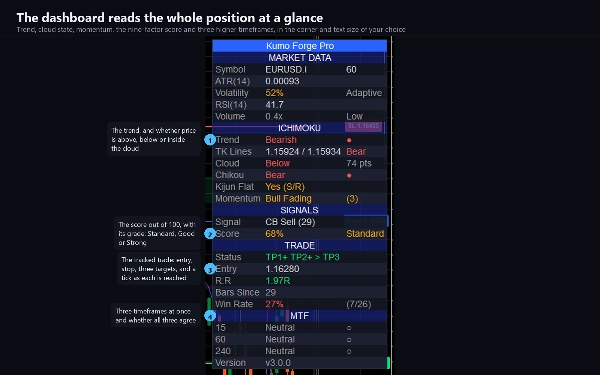
- A dashboard of up to 28 rows: ATR, volatility, RSI, volume, trend, the two line values, cloud state and

thickness, Chikou, momentum, the signal and its grade, the live trade status, R:R, and a

three-timeframe alignment panel.


HOW THE SCORING WORKS


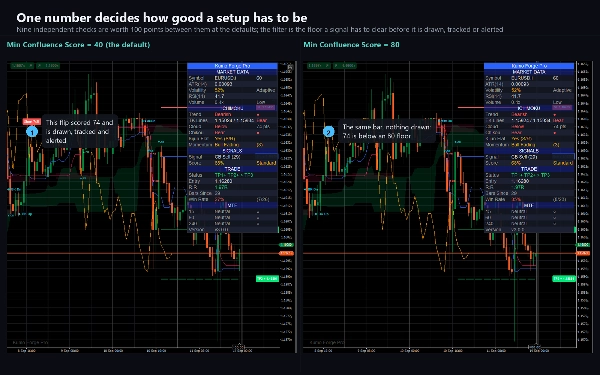
Nine factors, each worth a fixed number of points: price against the cloud (20), the two lines aligned

(15), Chikou agreement (15), cloud direction (10), cloud thickness (8), volume (10), momentum (12),

momentum acceleration (10), and optionally RSI (10). A signal must reach Min Confluence Score - 40 out of

100 by default - before it is drawn at all. Raise it for fewer and better signals; lower it for more.


Two of the nine do not depend on direction, so a thin cloud on low volume drags both the bullish and the

bearish score down together, and nothing fires either way. That is deliberate: it is the market telling

you there is nothing there.


FIVE SIGNAL TYPES, ALL ON CLOSED BARS


1. Tenkan/Kijun cross, the classic trigger, with the score on the plate.

2. Kijun bounce - price dips to the base line and closes back above it in an uptrend.

3. Cloud-edge bounce - the same idea against the cloud boundary.

4. Kumo breakout, with a volume requirement, plus a retest marker when price returns to the broken edge.

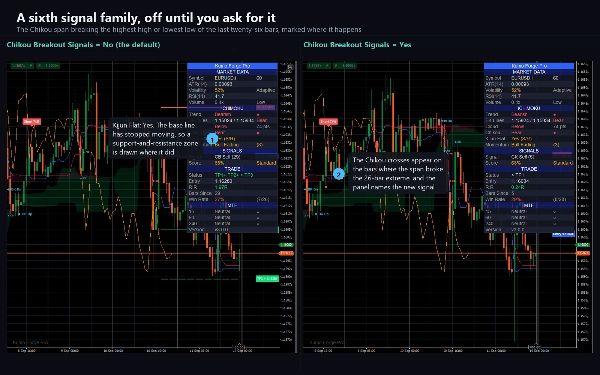
5. Chikou breakout, the most delayed confirmation, off by default.


Every signal is evaluated on a closed bar and never moves once that bar has closed.


THE SMART TP/SL ENGINE


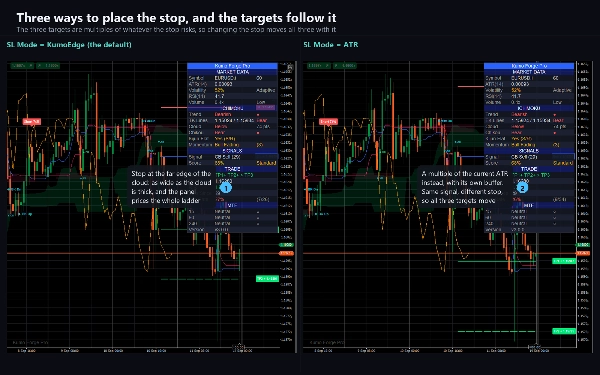
After each signal it draws an entry, a stop and three targets. The stop comes from the nearest cloud

edge, the Kijun line, or a straight ATR multiple - your choice - and the three targets are risk

multiples of it, 1.5R, 2.5R and 4R by default. The panel tracks which have been reached and shows the

live R:R of the open idea.


THE MULTI-TIMEFRAME PANEL


Three timeframes - M15, H1 and H4 by default, any three you like - each reporting bullish, bearish or

neutral from the same Ichimoku test, plus whether all three agree. A higher-timeframe row settles when

that timeframe's bar closes.


ALERTS


Twenty-three events across thirteen switches: both crosses, both breakouts, both retests, both Kijun

bounces, both cloud bounces, both Chikou breaks, each of the three targets, the stop, the two alignment

events, the three trend changes and the two strong-signal events. Each goes to the cTrader log, a sound

and an e-mail, with a JSON body available for anything that reads your log.


KEY SETTINGS


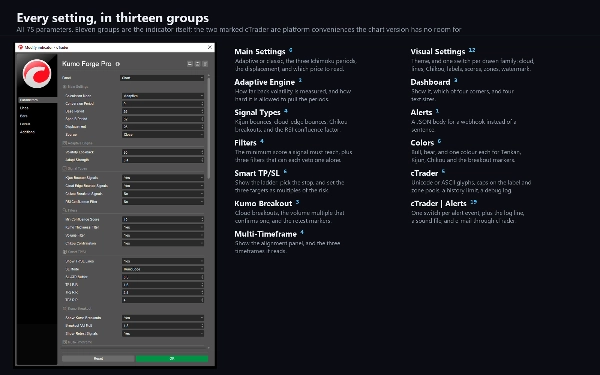
Calculation Mode chooses Adaptive or Classic. The three Ichimoku periods and the displacement are all

adjustable. Min Confluence Score is the one dial that changes how much it draws. SL Mode and the three

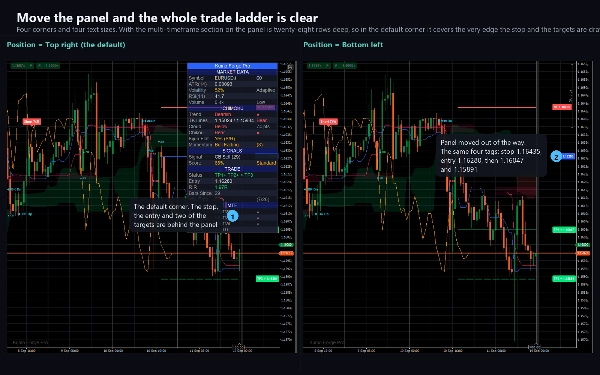
R:R multiples shape the trade drawing. Every visual element has its own switch, the dashboard has four

positions and four text sizes, and all six colours are yours.


Seventy-five parameters in all, every one documented, with defaults that work on the first chart you put

it on.


INDICATOR TYPE AND WINDOW


An overlay indicator: it draws on the price chart, not in a separate pane. It reads bars and tick volume

only.


PREFERRED TIMEFRAMES AND INSTRUMENTS


M15 to H1 is where the 9 / 26 / 52 periods were designed to work and where the default multi-timeframe

set sits naturally above the chart. H4 and D1 give fewer, slower signals with wider clouds. M1 and M5

work but produce many more signals - raise Min Confluence Score first.


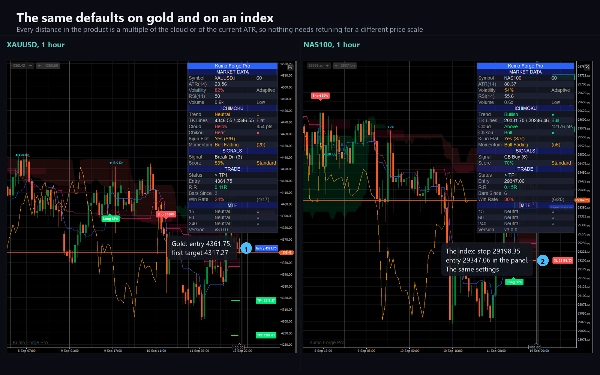
Built and verified on EURUSD; the logic is symbol-agnostic and is used on major and minor forex pairs,

gold and silver, indices, oil and crypto. The volume filter needs a symbol whose feed carries tick

volume, which forex and CFDs do.


WHO IT IS FOR


Traders who already read Ichimoku and want the cloud to keep up with a changing market, the confluence

arithmetic done for them, and the trade levels drawn rather than measured by hand. It suits swing and

intraday trading on M15 and above.


WHAT IT IS NOT


It is not an automated system. It places no orders, opens no network connection and reads no file - it

declares no access rights at all, which you can check in the algorithm's details.


THE TRIAL


The trial is the same product restricted to EURUSD, with any broker suffix accepted. There is no time

limit and nothing is withheld: all five signal types, all four filters, the full TP/SL engine, the

zones, the panel, the dashboard, all 23 alerts and all 75 parameters. The full version adds every other

symbol.


TECHNICAL NOTES


cTrader Desktop 5.x. The signals do not repaint. The five trade lines are redrawn each bar so they keep

reaching the right-hand edge, and the multi-timeframe rows settle when their own bar closes - both are

documented in the package. cTrader shows a right-hand margin only with Chart Shift enabled, so the price

tags are pinned just inside the right edge.


SUPPORT


Through the Discussion tab on this page. Please include your broker, symbol, timeframe, cTrader version

and a screenshot of the whole chart including the panel.


Trading involves risk. Past performance does not guarantee future results.

摘要

指标配置
指标分类
趋势
输出类型
信号
可视化
数据要求
交易量
支持的信号
交叉
突破
触及水平位
趋势强度

客户评价

0.0
评价:0
客户评价
该产品尚无评价。已经试过了?抢先告诉其他人!

讨论

常见问答

Key Levels
RSI
Ichimoku
Volume
ATR
Support & Resistance
cTrader Store 提供的所有产品,包括交易机器人、指标和插件,均由第三方开发者提供,仅供信息参考和技术访问之用。cTrader Store 并非经纪商,不提供投资建议、个人推荐或任何未来业绩保证。

该作者的其他作品

指标
ADX
ATR
+5
SuperTrend signals scored on five confluence factors, with an ATR stop, three targets and a dashboard.
指标
ADX
ATR
+5
Scored breakouts of sloped pivot trendlines: four filters on the break bar, ATR stop, 1:1 / 1:2 / 1:3 targets, alerts.
指标
ATR
RSI
+5
Supply and demand zones with break of structure, higher timeframe MA signals, a percent stop and three targets.
指标
ATR
Volume
+3
Fibonacci trend signals on closed bars, with an ATR stop, up to four targets and a break-even ladder.
指标
ADX
ATR
+5
Ten confluence layers scored on every closed bar, with an anti-chop gate, pivot levels and a live dashboard.
指标
Volume
Channel
+3
A higher-timeframe log-regression channel with a volume profile, Point of Control and session levels.
指标
Volume
Key Levels
+1
Fixed-grid volume profile: bull and bear volume at every price level, with Point of Control and value area.
指标
ATR
BOS
+5
Know how strong each Supertrend flip is: scored BUY/SELL, structure stop + 3 targets, live win-rate dashboard, alerts.
指标
ATR
EMA
+3
EMA trend, RSI reclaim and divergence signals with ATR stop and two targets, swing levels and a 16-row dashboard.

猜您喜欢

指标
Volume
Key Levels
+4
Session & Kill Zone Highlighter - Visual tool for London, NY, Tokyo, Sydney sessions plus ICT Kill Zones.
指标
MACD
Prop
+14
Enhance MACD Histogram! Visualize bull and bear price changes with vibrant colors for clearer, more insightful trading.
指标
ATR
RSI
+9
🚀 MACARX Indicator - The Multi-Indicator Trend Fusion 🚀
指标
ZigZag
Indices
+2
Auto Trendlines, Fibonacci, Pitchfork and Patterns from non‑repainting pivots. One‑click Presets, targeted Alerts, and a
指标
Volume
Order Block
+4
Volume Profile with fixed period, custom range and buy/sell pressure.
指标
Key Levels
Support & Resistance
Clean psychological round-number grid with native pip and point auto-scaling across Forex, Gold, Indices, and Crypto.
指标
AI
Prop
+9
Phoenix Zones - Detector de Reversiones Críticas
指标
ATR
BOS
+5
Know how strong each Supertrend flip is: scored BUY/SELL, structure stop + 3 targets, live win-rate dashboard, alerts.
指标
Aggressive
Supertrend
+5
Stop trading with tunnel vision! 🚫 The Heat Map Dashboard is an institutional-grade visual trading assistant
指标
RSI
Forex
+12
Indicator pattern signal moment
指标
Volume
Key Levels
+1
Fixed-grid volume profile: bull and bear volume at every price level, with Point of Control and value area.
指标
ADX
ATR
+5
Ten confluence layers scored on every closed bar, with an anti-chop gate, pivot levels and a live dashboard.
指标
AI
ATR
+26
Session Volume Profile + Composite. POC/VAH/VAL, Focus/Solo. Fast, clean, no ghosts, live-ready.
指标
Forex
BTCUSD
+11
Catch High-Probability Reversals with Precision Swing
指标
BOS
CHOCH
+4
Dual-track market structure detection with BVC order flow confirmation and two-stage liquidity sweep validation.
指标
Clean trend indicator using CCI & ATR. Highlights up/down trends with adaptive, no-repaint lines.
"ORB v1.1" 标识
人气
4.0
(4)
$25
指标
Breakout
Opening Range Breakout v1.1 - Visuals + Stats
指标
BOS
Volume
+5
20/40/60-day IPDA lookback ranges, Premium/Discount/Equilibrium zones, and quarterly shift alerts — anchored to true dai

价格

1
销售