

الوصف
الفكرة
أربعة أدوات فيبوناتشي وثلاثة أدوات هندسية تشارك نفس هيكل التأرجح المكتشف تلقائيًا بدلاً من الاعتماد على مراجع يدوية منفصلة.
المشكلة
يصبح التحليل الهندسي مملًا عندما يتطلب كل أداة اختيار تأرجح خاص بها.
ابحث عن التأرجح.
ارسم التراجع.
ابحث عن نفس التأرجح مرة أخرى.
ارسم المروحة.
ابحث عن ثلاثة تأرجحات للشوكة.
اضبط القناة.
ثم أعد رسم كل شيء عندما ينشئ السعر تأرجحًا جديدًا.
لكن هناك مشكلة أخرى تتجاوز العمل اليدوي.
عندما يتم بناء كل أداة بشكل مستقل، قد ينتهي بها الأمر باستخدام مراجع تأرجح مختلفة قليلاً.
قد يصف التراجع حركة واحدة.
قد تصف المروحة حركة أخرى.
قد تستخدم الشوكة تسلسلًا مختلفًا من ثلاث نقاط.
قد تبدو الإسقاطات الناتجة مفيدة بشكل فردي بينما تصف في الواقع أجزاء مختلفة من السوق.
المشكلة ليست فقط في إعادة رسم الهندسة. بل في الحفاظ على اتصال الهندسة بنفس الهيكل الأساسي.
المفهوم الأساسي: التأرجحات تلقائية. الهندسة تبقى متسقة.
تقوم مجموعة فيبوناتشي للرسم التلقائي بالكشف عن هيكل التأرجح الأساسي مرة واحدة.
ثم تستخدم الأدوات الهندسية المفعلة نفس الهيكل تلقائيًا.
هذا يخلق نظام مرجعي مشترك عبر قياسات هندسية مختلفة.
خريطة تأرجح واحدة. عدة رؤى هندسية.
يمكن أن تتغير الهندسة مع تطور هيكل التأرجح، بينما يبقى المرجع الأساسي متسقًا.
الهدف ليس إنشاء سبعة إشارات مستقلة.
بل السماح لأدوات هندسية مختلفة بوصف نفس هيكل السوق.
ما يفعله
يقوم المؤشر بأتمتة بناء وصيانة سبعة أدوات هندسية:
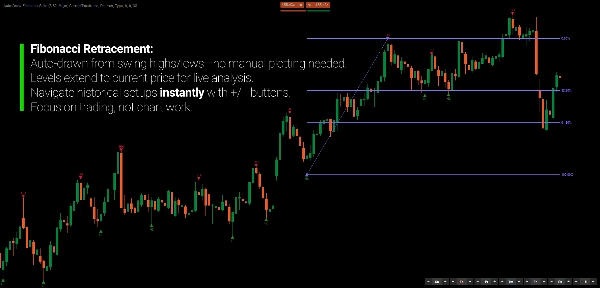
- تراجع فيبوناتشي
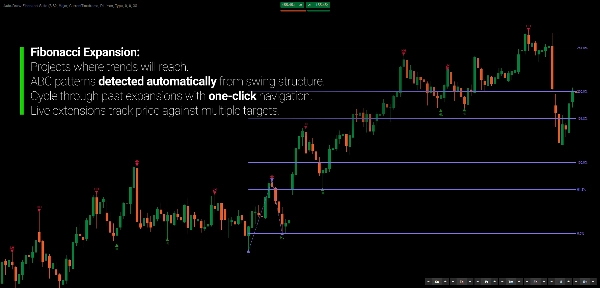
- توسع فيبوناتشي
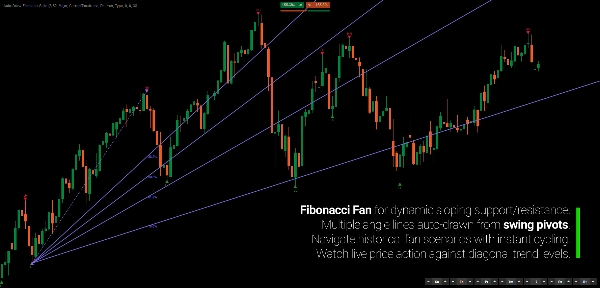
- مروحة فيبوناتشي
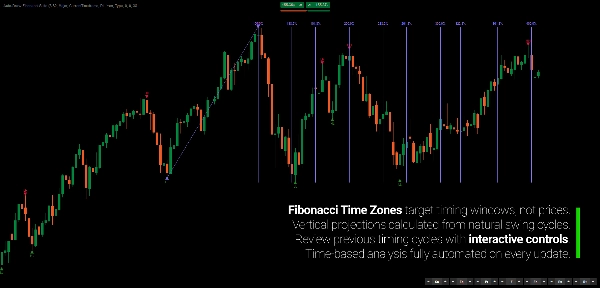
- مناطق زمنية فيبوناتشي
- شوكة أندروز
- قناة متساوية المسافات
- مروحة جان
بدلاً من اختيار وتحديث نقاط المرجع يدويًا لكل أداة، تستمد المجموعة هذه النقاط من اكتشاف التأرجح المشترك.
عندما يتطور تأرجح جديد، يتم تحديث الإسقاطات ذات الصلة تلقائيًا.
الهندسة تتبع الهيكل.
كيف يعمل
العملية بسيطة عن عمد.
1. اكتشاف التأرجحات.
يحدد المؤشر نقاط التأرجح باستخدام محرك الكشف القائم على الانحدار.
2. بناء هيكل التأرجح.
يتم تصنيف التأرجحات وتنظيمها في تسلسل متماسك.
3. إسقاط الهندسة.
تستخدم كل أداة مفعلة مراجع التأرجح المناسبة تلقائيًا.
4. دع السعر يتطور.
عندما يتشكل تأرجح جديد، يتم تحديث الإسقاطات النشطة.
لا تعيد رسم سبع أدوات.
الهندسة تتبع الهيكل.
سبع أدوات. نظام مرجعي واحد.
تتضمن المجموعة أربعة أدوات قائمة على فيبوناتشي:
تراجع فيبوناتشي
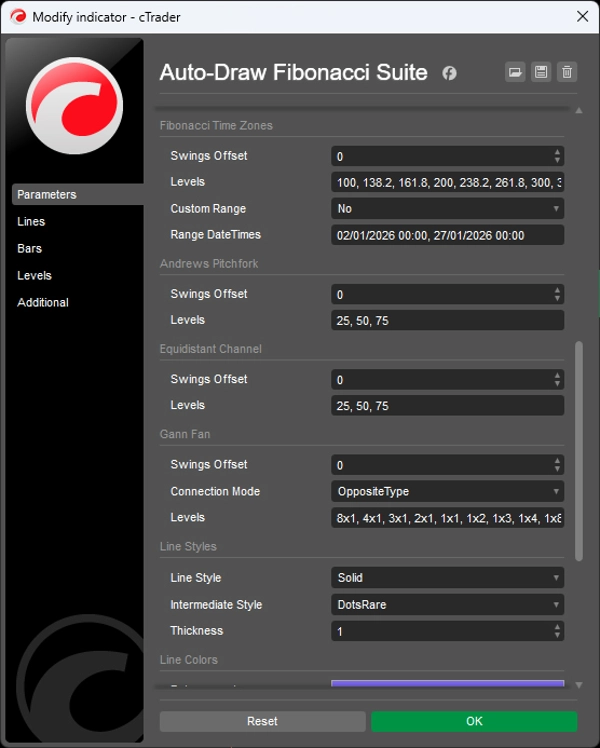
مستويات أفقية نسبية بين التأرجحات الهيكلية، بما في ذلك 0%، 38.2%، 61.8%، و100%.
توسع فيبوناتشي
يسقط علاقات فيبوناتشي بعد التأرجح الثالث.
مروحة فيبوناتشي
يسقط علاقات فيبوناتشي القطرية من المحاور الهيكلية.
مناطق زمنية فيبوناتشي
يسقط فواصل زمنية قائمة على فيبوناتشي على محور الزمن.
وثلاثة أدوات هندسية تكميلية:
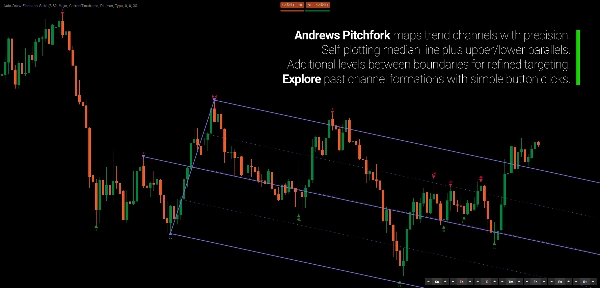
شوكة أندروز
إطار وسطي ثلاثي النقاط مع قنوات متوازية.
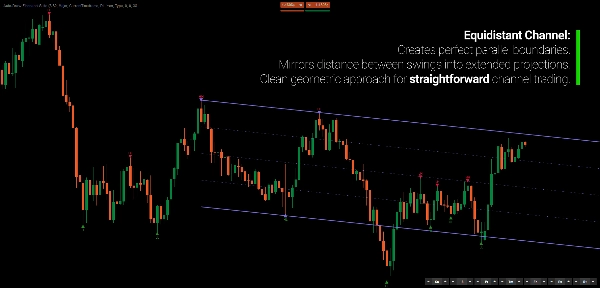
قناة متساوية المسافات
حدود سعرية متوازية مع مستويات وسيطة.
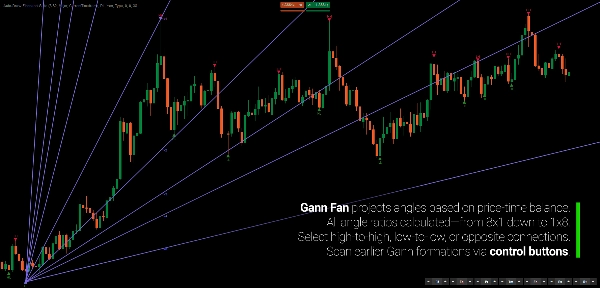
مروحة جان
إسقاطات زاوية السعر إلى الوقت عبر نسب هندسية متعددة، بما في ذلك 8x1، 4x1، 2x1، 1x1، 1x2، وغيرها.
يمكن تفعيل كل أداة بشكل مستقل.
يتم اكتشاف التأرجح مرة واحدة
هذا هو أساس المجموعة.
مع التحليل اليدوي التقليدي، قد تستخدم كل أداة هندسية محاور مختلفة قليلاً.
تحافظ مجموعة فيبوناتشي للرسم التلقائي على اتصالها بنفس اكتشاف التأرجح الأساسي.
هذا يمنح الإسقاطات المختلفة مرجعًا مشتركًا.
تبقى الهندسة متماسكة لأن هيكل المصدر يبقى متماسكًا.
اختر مقدار الهيكل الذي تريده
ليس كل مخطط يتطلب نفس مستوى التفاصيل.
اختر بين ثلاث حساسات للتأرجح:
رئيسي
تأرجحات أقل وأوسع لرؤية على مستوى أعلى.
قياسي
رؤية متوازنة لهكيل التأرجح المتطور.
ثانوي
تأرجحات أكثر تفصيلاً لفحص الحركة الداخلية.
يمكن أيضًا تصنيف التأرجحات كالتالي:
- HH
- HL
- LH
- LL
تشمل معلومات التأرجح الإضافية العمق، الحجم، والمدة. تميز العلامات البصرية بين التأرجحات المؤكدة، غير المؤكدة، والتأرجحات الداخلية.
الهدف ليس فرض تعريف واحد للهيكل على كل سوق.
اختر مستوى التفاصيل الذي يتناسب مع الحركة التي تدرسها.
التحرك عبر الهيكل
لا يجب أن تبقى الهندسة مقفلة على أحدث تأرجح.
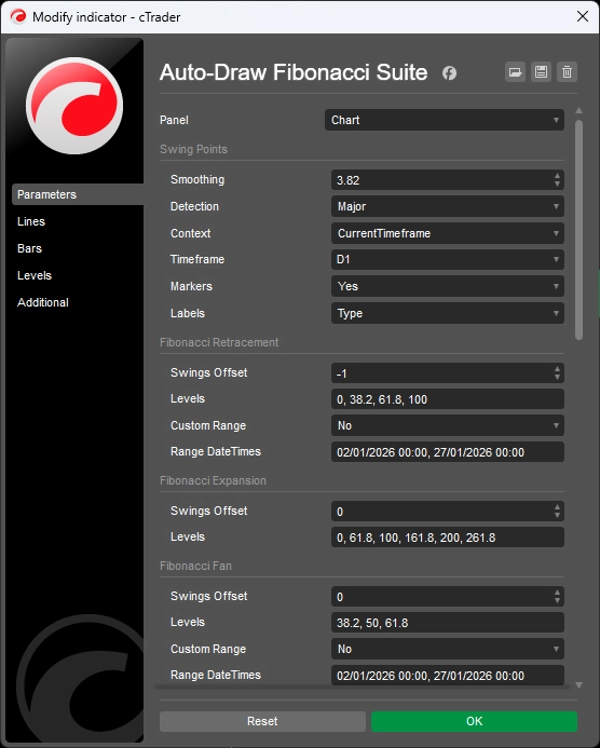
لكل أداة تحكم إزاحة خاص بها:
0 → هيكل التأرجح الحالي
-1 → الهيكل السابق
-2 → هيكلان للخلف
هذا يتيح لك استكشاف كيف بدت العلاقات الهندسية في نقاط سابقة من السوق دون إعادة بناء الأدوات يدويًا.
يمكنك أيضًا تغيير مرجع إسقاط واحد دون تغيير الآخرين.
الهيكل مؤتمت. المرجع يبقى تحت سيطرتك.
الهندسة بإطار زمني أعلى على مخطط بإطار زمني أدنى
يمكن أن يأتي اكتشاف التأرجح من إطار زمني أعلى بينما تبقى الإسقاطات الهندسية مرئية على مخططك الحالي.
على سبيل المثال:
تأرجحات يومية → مخطط H1
هذا يسمح للسياق الهندسي بإطار زمني أعلى بالبقاء مرئيًا أثناء تحليلك أو تنفيذك على إطار زمني أدنى.
لا حاجة لتبديل الإطار الزمني بشكل متكرر.
لا حاجة لإعادة إنتاج التأرجحات بإطار زمني أعلى يدويًا.
الهندسة هي لغة قياس
نسب فيبوناتشي، الشوك، القنوات، المراوح، والإسقاطات الزمنية لا تحتاج لأن تعامل كتنبؤات.
إنها توفر طرقًا مختلفة لوصف العلاقات بين السعر، الزمن، والحركة السابقة.
التراجع يصف حركة السعر النسبية.
المروحة تصف العلاقات القطرية.
المنطقة الزمنية تصف التباعد الزمني.
القناة تصف الحركة المتوازية.
الشوكة تصف العلاقات الوسطية.
عندما تتقارب عدة إسقاطات، يمكنك فحص هذا التقارب كعلاقة هندسية عبر أبعاد قياس مختلفة.
الهندسة تصف السوق. لا تسبب السوق.
مصمم للتحليل، وليس لمطاردة الإشارات
مجموعة فيبوناتشي للرسم التلقائي ليست نظام إشارات شراء/بيع.
إنها أداة أتمتة للمتداولين الذين يستخدمون بالفعل تحليل فيبوناتشي والهندسة لكنهم لا يريدون قضاء وقتهم في صيانة الرسومات.
استخدمها لدراسة:
- التراجعات
- التوسعات
- إسقاطات التأرجح
- التقاء هندسي
- قنوات السعر
- علاقات السعر إلى الوقت
- هيكل بإطار زمني أعلى
- تطور العلاقات الهندسية مع تطور السعر
لا يقرر المؤشر ما يعنيه إسقاط معين بالنسبة لك.
يحافظ على تزامن الهندسة مع الهيكل الذي تدرسه.
الميزات الرئيسية
- اكتشاف التأرجح التلقائي
- مراجع تأرجح موحدة عبر جميع الأدوات الهندسية
- أربعة أدوات فيبوناتشي
- شوكة أندروز
- قناة متساوية المسافات
- مروحة جان
- تحديثات هندسية في الوقت الحقيقي
- حساسية التأرجح: رئيسي / قياسي / ثانوي
- تصنيف HH / HL / LH / LL
- مقاييس عمق التأرجح، الحجم، والمدة
- تجميع ذكي للتأرجحات لإزالة التأرجحات الوسيطة الزائدة
- تحكم إزاحة مستقل لكل أداة
- اكتشاف التأرجح متعدد الأطر الزمنية
- أدوات فردية اختيارية
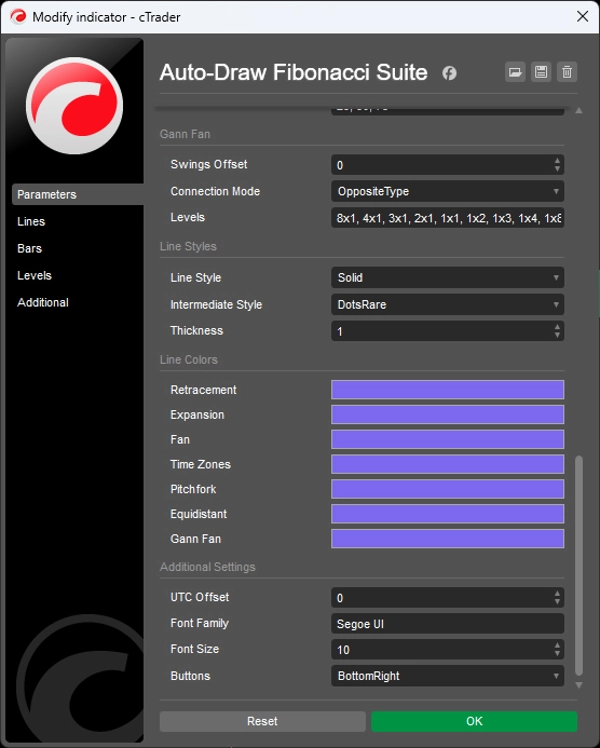
- مستويات فيبوناتشي وأنماط بصرية قابلة للتخصيص
- تأرجحات المصدر المميزة
---
التداول ينطوي على مخاطر. هذا المؤشر هو أداة تحليل فني ويجب استخدامه مع إدارة مخاطر مناسبة.
الملخص
The indicator employs a regression-based method for swing detection, offering three sensitivity modes (Major, Standard, Minor) to tailor swing granularity. Swings are classified (higher highs, lower lows, etc.) and visually marked for clarity. Users can interactively adjust which historical swings each tool references via offset controls, enabling analysis of past structural relationships independently per tool.
Multi-timeframe support allows applying swing detection from a higher timeframe while viewing a lower timeframe chart, facilitating comprehensive structural analysis without switching views. The suite is customizable in terms of levels, colors, and styles.
Designed for traders familiar with Fibonacci and geometric analysis, it streamlines workflow by automating complex, multi-tool geometric projections, supporting swing and position traders, multi-timeframe analysts, and discretionary traders seeking coherent, real-time updated geometric market structure visualization.
تقييمات العملاء
مناقشة
الأسئلة الشائعة






















السعر
